

Introduction
This is the second part of the “A Deep Dive into Penetration Testing of macOS Application” blog series. In the first part, we learned about macOS applications and their structure and demonstrated how to build a dummy application. We also talked about System Integrity Protection (SIP) and how to configure common network interception tools. Part two will dive deep into file and binary analysis.
TL;DR
This blog examines how to analyze a macOS application, including an overview of code signing, hardened runtime and entitlements. Besides that, we also cover various file and memory analysis techniques and tools.
Static File and Binary Analysis
While analyzing a macOS app, it is common practice to start by looking at the code signature. The signature contains metadata such as the certificate chain, entitlements and signing information, which can provide insight into the app’s functionality, safety and potential vulnerabilities.
What is Code Signing?
According to the Apple documentation: “Code signing is a macOS security technology that you use to certify that you created an app. Once an app is signed, the system can detect any change to the app—whether the change is introduced accidentally or by malicious code.”
Code signing works using a digital signature created with a private key and verified with a public key. The signature is attached to the application, and the operating system can verify it using a public key stored in its trusted root certificate store.
Unlike Windows, where code signing is optional and third-party certificates can be used, macOS requires code signing with an Apple-issued Developer ID certificate. From macOS 10.15 on, all applications distributed through and outside the App Store must be signed and notarized by Apple to run under the default Gatekeeper settings.
Gatekeeper is a security technology that is designed to help ensure that only trusted software runs on a user’s Mac.
By default, Gatekeeper only allows apps downloaded from the Mac App Store or developers registered with Apple and obtained a Developer ID certificate. If an app hasn’t been signed with a valid certificate or notarized by Apple, Gatekeeper will display a warning message and prevent the app from running.
Alternatively, users can override Gatekeeper policies to open any software unless restricted by a mobile device management (MDM) solution.
With the codesign utility tool, it is possible to obtain comprehensive information about an application, including its hash type, hash checksum and signing authority.
By running the following command, we can display a code signature of the application (Figure 1):
codesign -dvv "<path to application>"
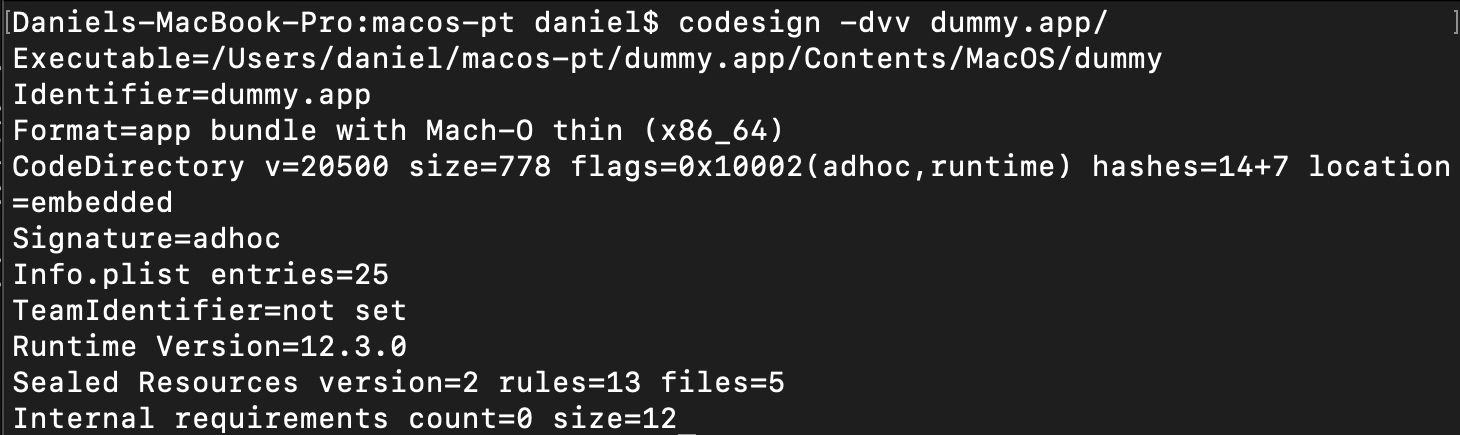
Figure 1: Code signature of dummy app
In some cases, an application may not have a valid digital signature. This can occur, for example, if the application uses an untrusted certificate (one that is expired or has a missing issuer) or if some of the resources within the application bundle do not have a valid signature.
One of the interesting ways to bypass the code signing mechanism was discovered related to the “TeamIdentifier” field.
TeamIdentifier is a unique identifier code assigned to a team of developers upon registration in the Apple Developer Program, which is used to sign applications and install configuration profiles on macOS devices.
Long story short, a bypass is found in how third-party developers interpret the code signing API, which allows binary with adhoc signatures, typically used for testing purposes, to appear as if Apple has signed them. This bypass was possible because some Apple applications had a TeamIdentifier value set to “not set.” For more information, you can visit that Ref.
Hardened Runtime
The next interesting thing we can learn by analyzing code signatures is whether or not the Hardened Runtime is applied to the application. According to the Apple documentation:
“The Hardened Runtime, along with System Integrity Protection (SIP), protects the runtime integrity of your software by preventing certain classes of exploits, like code injection, dynamically linked library (DLL) hijacking, and process memory space tampering.”
We can see the level of protection provided by the Hardened Runtime in the code signature with the SecCodeSignatureFlags. These flags are displayed in the CodeDirectory line in the output of the codesign command.
The SecCodeSignatureFlags are a set of bitwise flags describing various signed code characteristics. The value of 0x0 means that the binary has a standard code signature without additional security features or restrictions (Figure 2). This is the default state for code signing in macOS, and it is suitable for most applications without special security requirements.
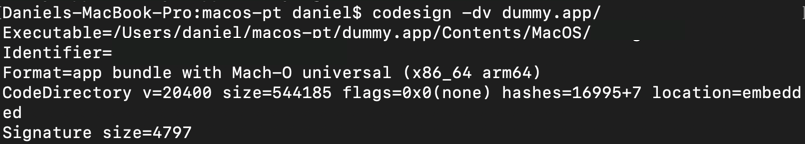
Figure 2: The Dummy app without restrictions
The flag 0x10000 indicates the application has applied runtime hardening policies, such as ASLR, library validation, sandboxing, system call filters, and code signature validation. These policies work together to prevent memory-based vulnerabilities, restrict system access and prevent malicious code injection. Also, the value of the flags can be merged, such as in the example below (Figure 3), where the dummy application has flag 0x10002 because it both has adhoc signature (0x0002) and runtime hardening policies (0x10000).
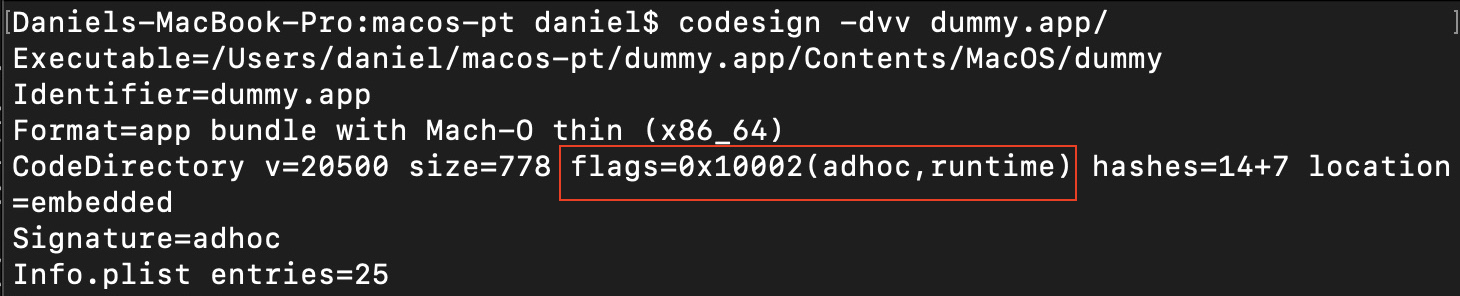
Figure 3: The Dummy app with runtime hardening policies
The list of all possible flags:
kSecCodeSignatureHost              = 0x0001, /* may host guest code */
kSecCodeSignatureAdhoc             = 0x0002, /* must be used without signer */
kSecCodeSignatureForceHard         = 0x0100, /* always set HARD mode on launch */
kSecCodeSignatureForceKill         = 0x0200, /* always set KILL mode on launch */
kSecCodeSignatureForceExpiration   = 0x0400, /* force certificate expiration checks */
kSecCodeSignatureRestrict          = 0x0800, /* restrict dyld loading */
kSecCodeSignatureEnforcement       = 0x1000, /* enforce code signing */
kSecCodeSignatureLibraryValidation = 0x2000, /* library validation required */
kSecCodeSignatureRuntime           = 0x10000,/* apply runtime hardening policies */
kSecCodeSignatureLinkerSigned      = 0x20000,/* identify that the signature was auto-generated by the linker*/
Some applications may rely on a capability that the Hardened Runtime restricts. In this case, developers can use Runtime Exceptions to disable individual protection (Figure 4).
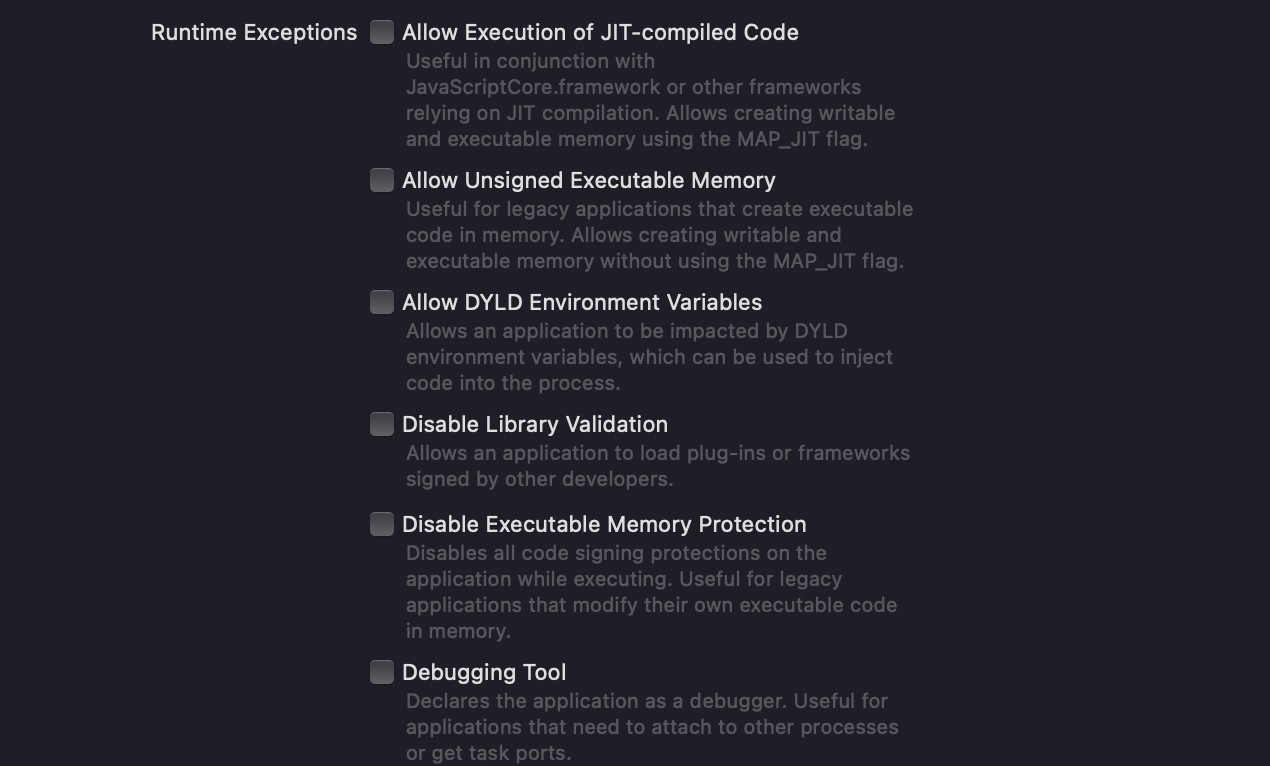
Figure 4: Runtime Exceptions in Xcode
Enabling Runtime Exceptions may expose the application to potential attacks. We can check if the application has exceptions by looking at entitlements.
Entitlements
Entitlements are key-value pairs that grant to executable permission to use a service or technology.
Examining the entitlements is a key step of file analysis, as they indicate what actions an application can perform on a system, much like a set of permissions.
We have a couple of options to view an application’s entitlements. One way is to use the codesign tool by running the following command:
codesign -d --entitlements :- <path to binary file>
Alternatively, we can also use the jtool ( an extended version of otool created by Jonathan Levin) by running the following command:
jtool2 –ent ~/dummy.app/Contents/MacOS/dummy
By analyzing an application’s entitlements, we can identify potential security issues. For example, if an application has an allow-dyld-environment-variables entitlement with a “true” value (Figure 5), it can be used for Dylib Injection. There will be more about this in the third part of our blog series.
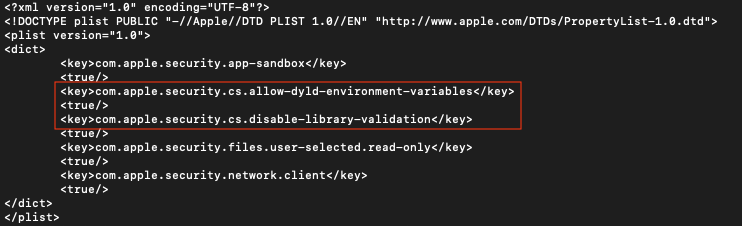
Figure 5: The dummy app has “allow-dyld-environment-variables” entitlements
Here are a few example entitlements:
| com.apple.security. cs.disable-library-validation |
The app can load arbitrary plug-ins or frameworks without requiring code signing. |
| com.apple.security.cs.allow-dyld-environment-variables | The app may be affected by dynamic linker environment variables, which you can use to inject code into your app’s process. |
| com.apple.security.get-task-allow | Binary allows other non-sandboxed processes to attach. |
| com.apple.security.cs.allow-unsigned-executable-memory | Exposes the app to common vulnerabilities in memory-unsafe code languages. |
| com.apple.security.files.downloads.read-write | The app may have read-write access to the Downloads folder. |
| com.apple.security.device.camera | The app may interact with the built-in and external cameras and capture movies and still images. |
An application may gain access to sensitive information or system resources if it has unnecessary or overly permissive entitlements.
For example, the com.apple.security.device.camera entitlement grants application permission to access the camera on a user’s Mac. However, starting from macOS 11 (Big Sur), this entitlement will trigger a TCC (Transparency, Consent and Control) prompt.
TCC is a macOS technology that manages an application’s access to sensitive user data, such as the camera, microphone and location services. TCC will prompt the user for consent before allowing the application access. The user can grant or deny access, and the decision will be stored by TCC so that the prompt does not reappear.
Hacks and Tricks
We can use various file analysis techniques to identify potential vulnerabilities when conducting penetration testing on a macOS application.
One of the techniques is to check the third-party libraries used by the application for any known security vulnerabilities. We can do this using otool, included in the Xcode command line tools package or jtool.
To obtain a list of the libraries used by an application, we can execute the otool -L <path to binary file> command (Figure 6) and search for vulnerable or outdated libraries.
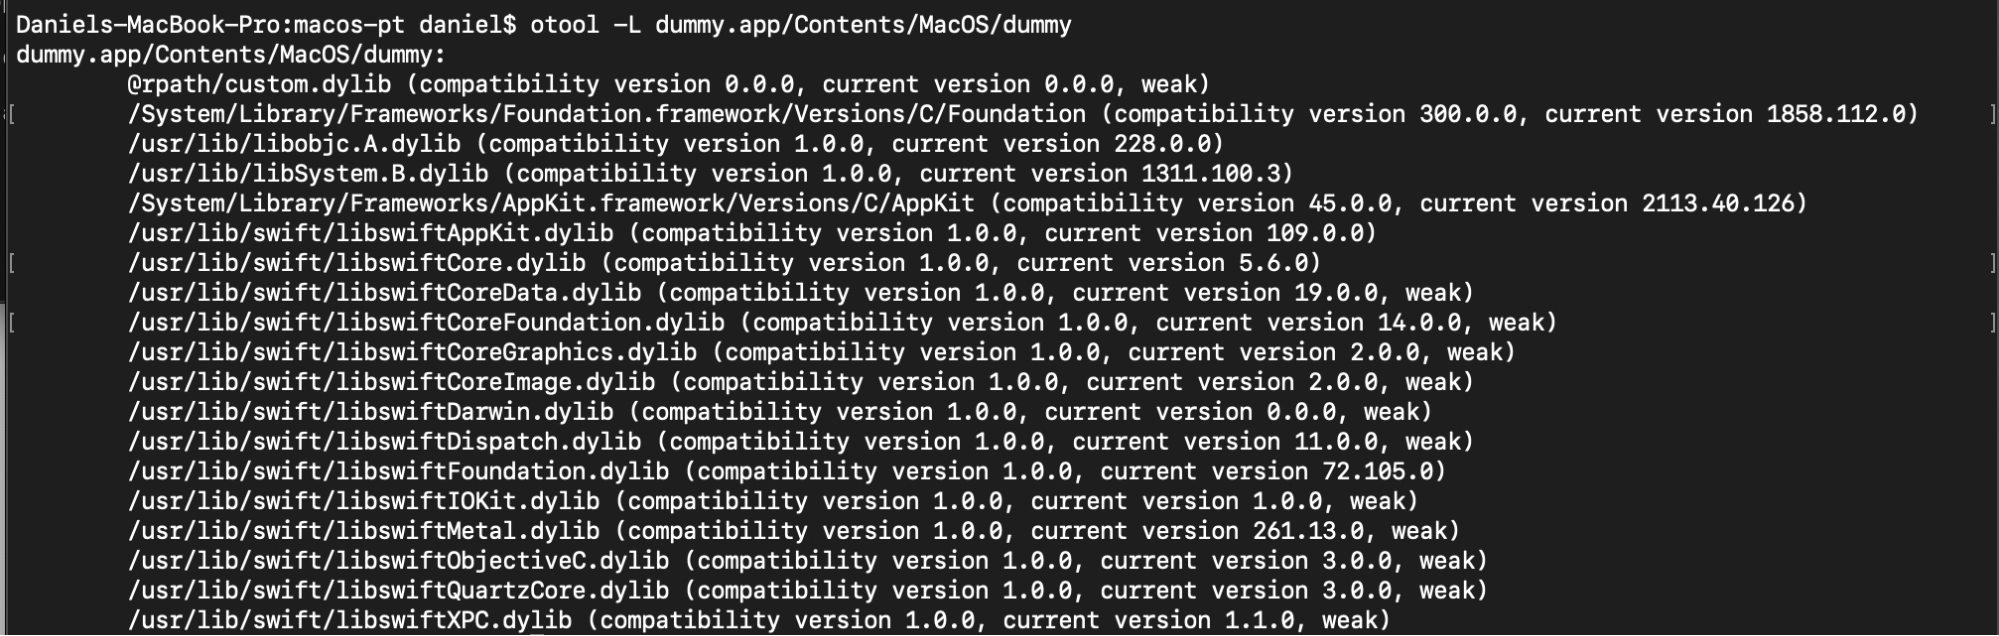
Figure 6: The Dummy app libraries
Using the nm command, we can retrieve function symbols and the applications’ variable names. For instance, to display the list of symbols in the binary file, we can run the
nm <path to binary file> command (Figure 7). Inside the output, look for known vulnerable functions or functions that are not securely used.
This command is also useful to determine in which programming language the application is written. A function that contains _objc can indicate that the application is developed in Objective-C, _swift can indicate Swift language, and so on.
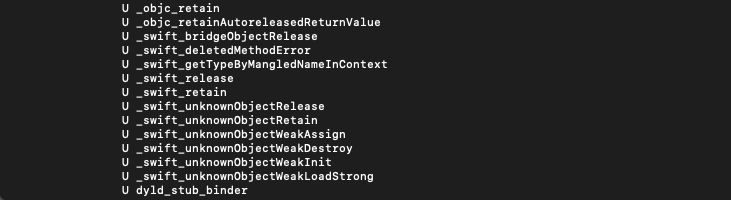
Figure 7: The Dummy app functions
Another key thing is to search for sensitive information, such as passwords, API keys and log files, which may be insecurely stored.
Some key files to check:
- Configuration files like .plist, XML, or JSON files, which are typically located in the application bundle.
- Log files, usually located in the ~/Library/Log directory.
- Cache files, stored as SQLite database files, which are typically located in the ~/Library/Caches directory but can be found in other locations on the system. These database files can be analyzed using tools such as SQLite Browser or SQLitestudio (Figure 8).
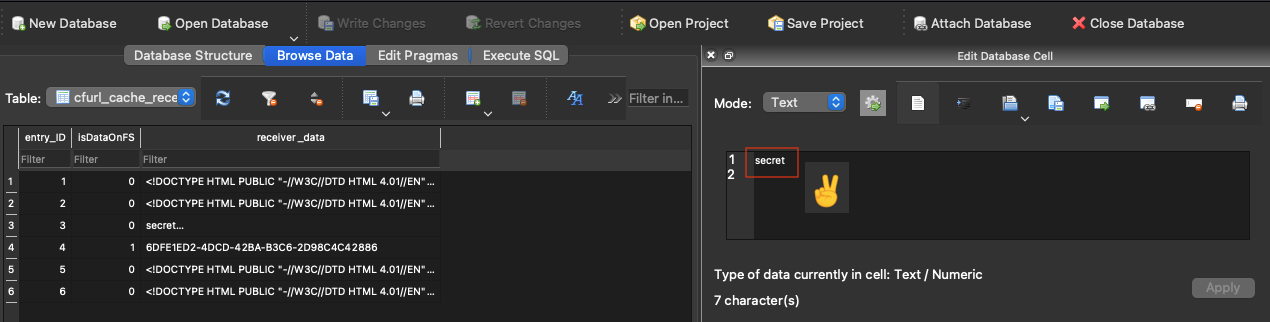
Figure 8: Cache file of dummy app
Looking at the Activity Monitor, we see a list of all the files the application has opened.
To do this, open Activity Monitor, select the application and click the “Open Files and Ports” tab (Figure 9).
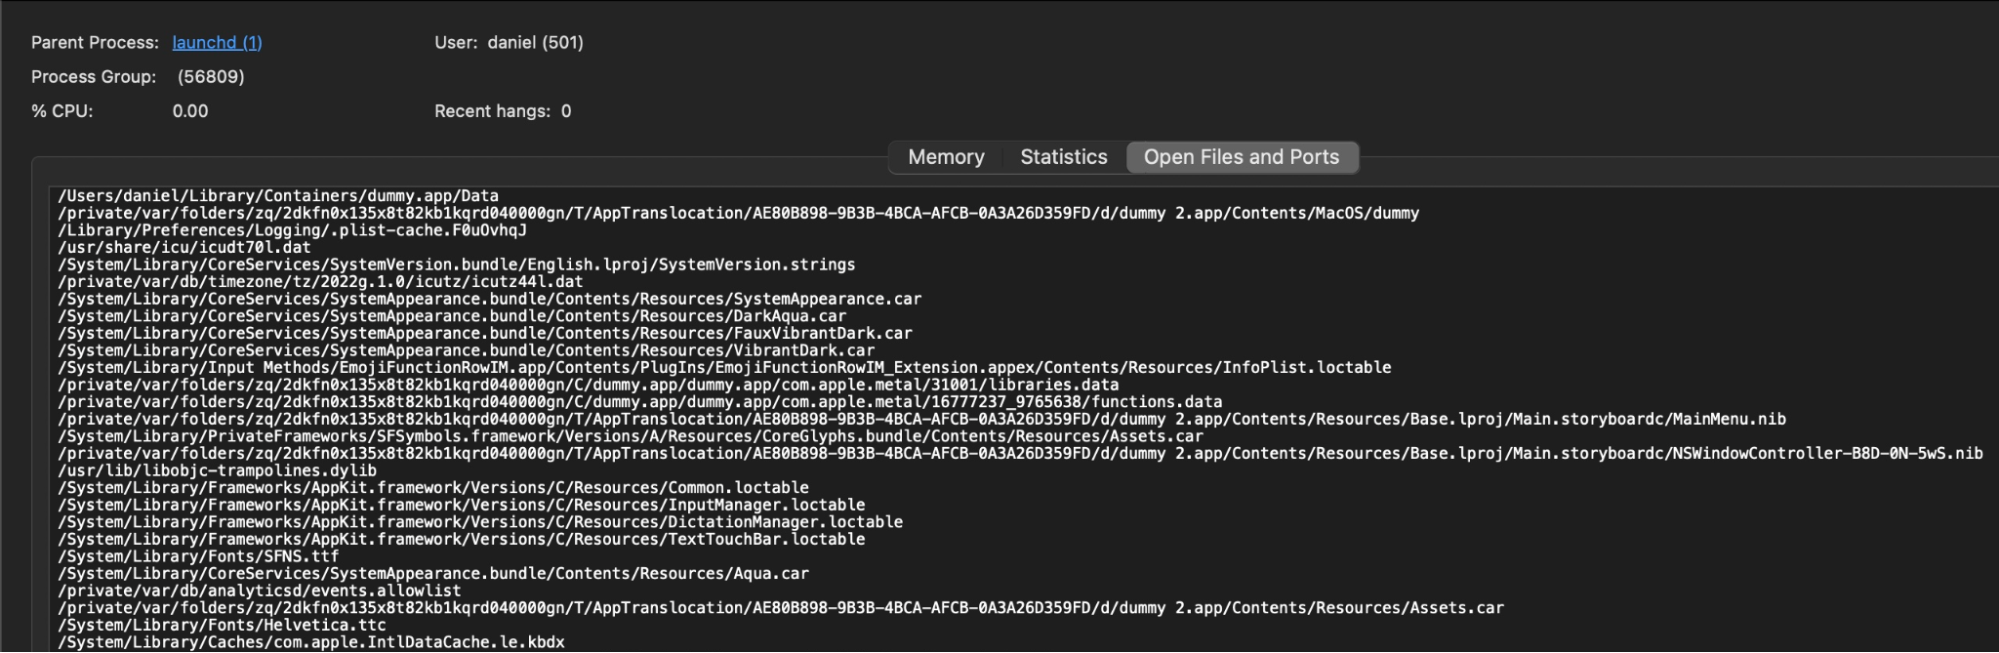
Figure 9: All files that the dummy app opens are shown in the activity monitor
Another way to find sensitive information is to extract text strings from binary files. For this purpose, we can use the strings<path to binary file> command.
We won’t dive deep into the reverse engineering process in this post, but we think it’s important to note that you can use disassembler software like:
These tools have capabilities to disassemble and decompile (generation of C-code, which is more human-readable, see Figure 10). That can help you find logical, memory corruption and other potential security issues in the compiled code.
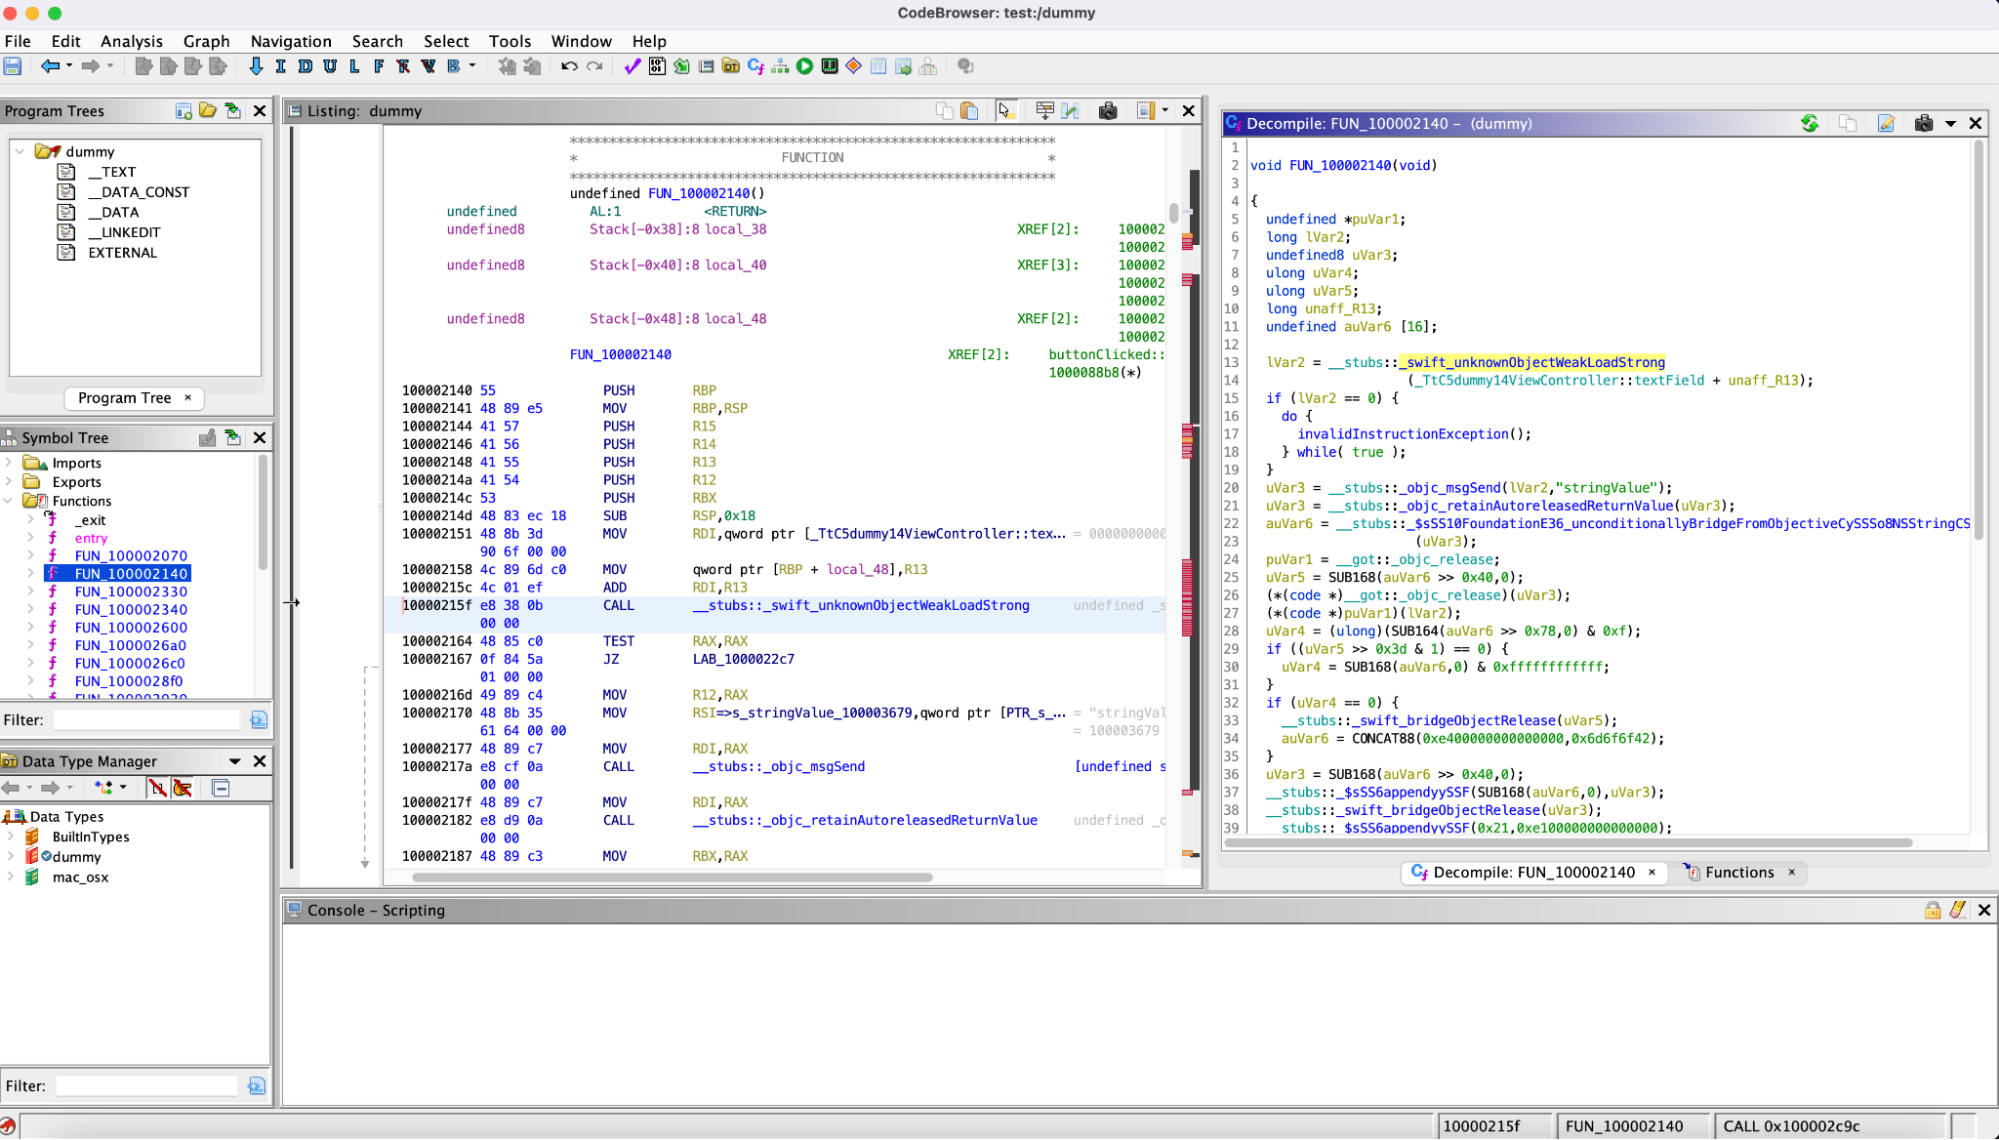
Figure 10: Decompiled code of dummy app in Ghidra
Dynamic Analysis
Here’s a list of common useful tools for dynamic analysis:
- Apple Instruments. Part of Xcode’s Developer tools – used for monitoring application performance, identifying memory leaks and tracking filesystem activity (Figure 11).
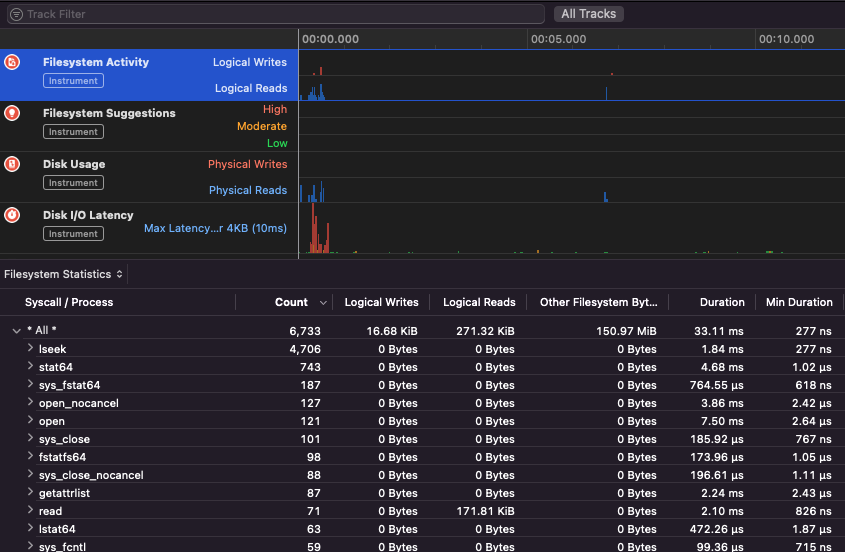
Figure 11: Apple Instrument
- TaskExplorer. Provides information about running tasks, including signature status, loaded dynamic libraries and open files.
- FileMonitor. Monitors file events such as creations, modifications and deletions.
- ProcessMonitor. Monitors process creations and terminations.
- Frida. Dynamic instrumentation toolkit for developers, reverse engineers and security researchers.
Frida
Let’s talk about Frida a little bit more. It is a dynamic analysis tool that can hook the internal APIs of a running application. Frida uses the V8 javascript engine to create a convenient environment to perform hooks and memory interceptions. That allows us to monitor and modify the application’s behavior in real-time.
We can install Frida using the command: pip3 install frida-tools.
After an installation, create a Frida script in JavaScript, which will be injected into the application.
For example, the following script intercepts the open function call in a macOS application and logs the file path and mode to the console:
Interceptor.attach(Module.findExportByName(null, "open"), { onEnter: function(args) {console.log("File path: " + Memory.readUtf8String(args[0])); console.log("Mode: " + args[1].toInt32()); } });
Use the frida -l command to inject the Frida script into the running macOS application (Figure 12).
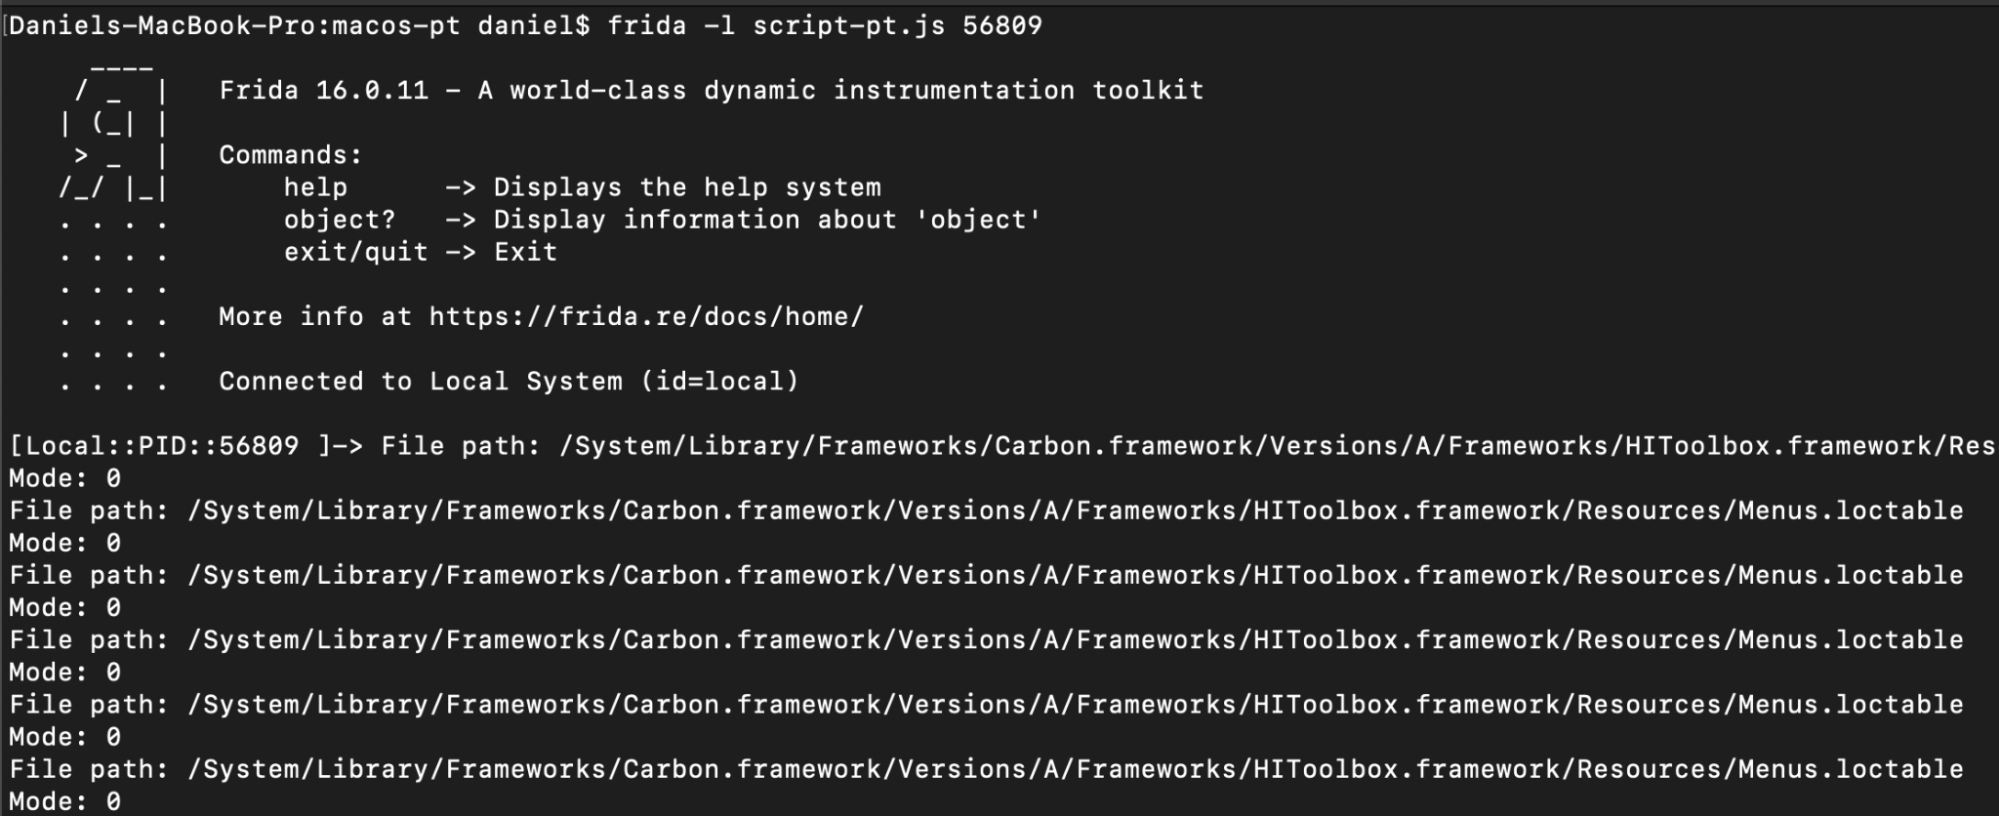
Figure 12: Frida’s usage
Memory Analysis
By reading the memory, we can find sensitive information that may be exposed to attackers, including passwords, encryption keys and other confidential information stored temporarily in memory during the execution of an application.
One way to analyze an application’s memory is to use the lldb tool, the default Xcode debugger, commonly used for dynamic analysis of macOS applications. It can attach to a running process, set breakpoints, inspect memory and step through code.
To search for sensitive data, we can create a dump of the process memory using the following steps.
First, let’s find the PID of our running process by the next command: ps aux | grep -i “testing app”…
Next, we need to use the lldb for attaching to the relevant process and dump its process memory.
lldb --attach-pid 44434 —> 44444 PID of process
💡 Remember: If SIP is enabled, we can still attach applications signed with the get-task-allow entitlement, which allows other processes (like the debugger) to attach to the app. https://developer.apple.com/documentation/bundleresources/entitlements/com_apple_security_cs_debugger
To dump the process, use the next command inside the lldb (Figure 13):
process save-core <output file>
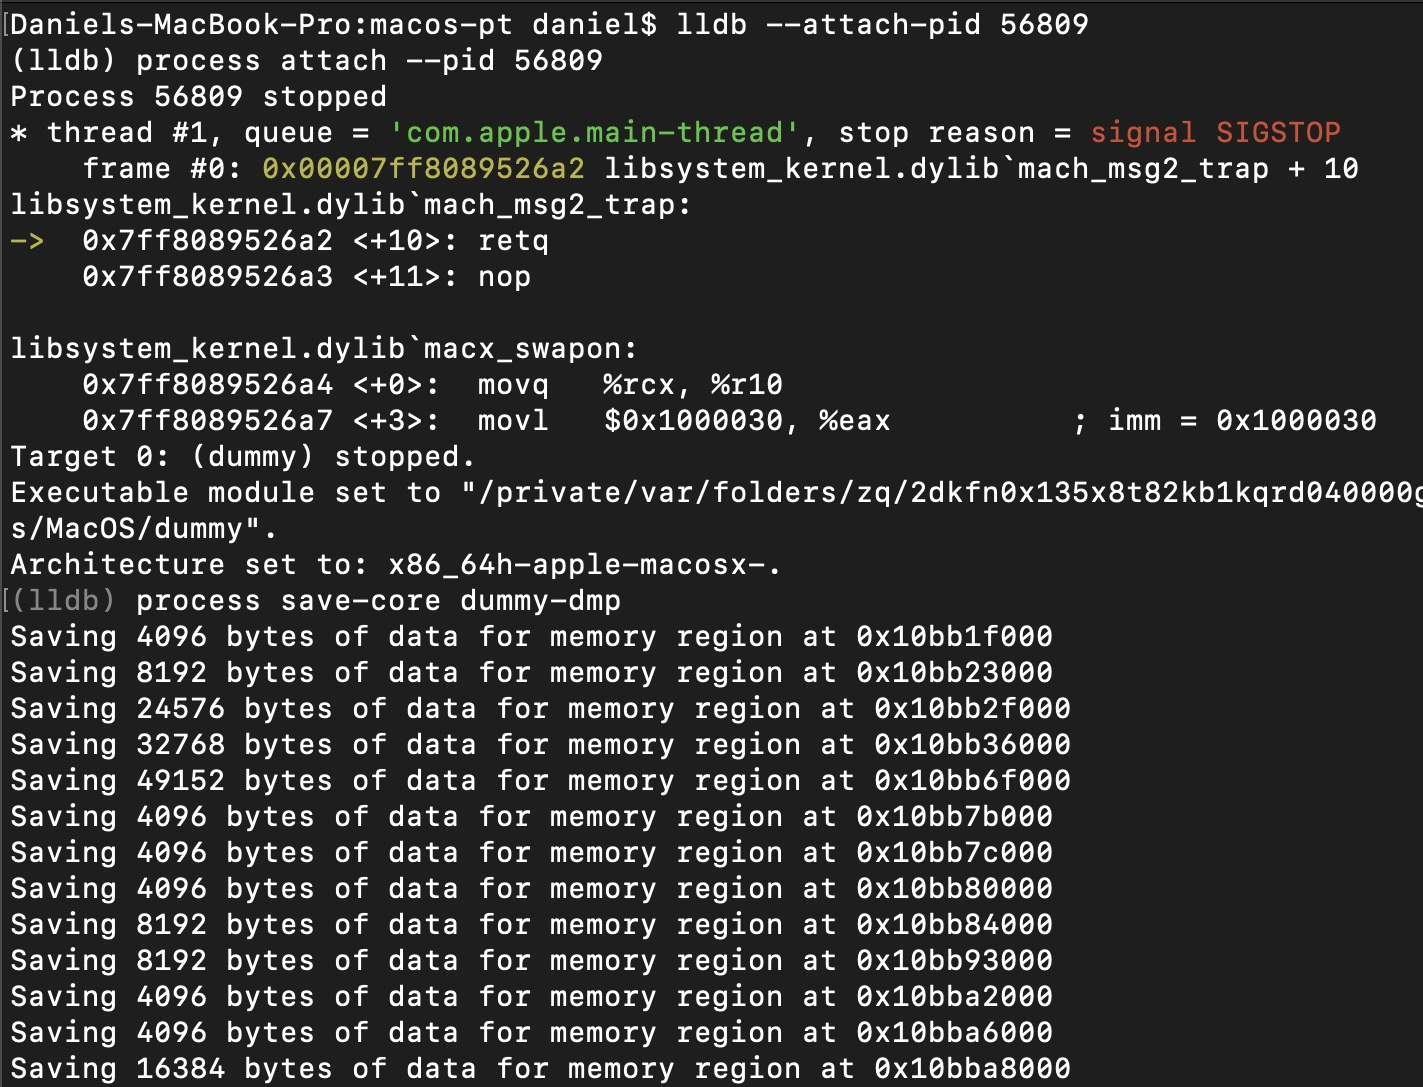
Figure 13: Creating a dump of the dummy process
After that, use the strings – <output file> to search for sensitive information in the output file (Figure 14).
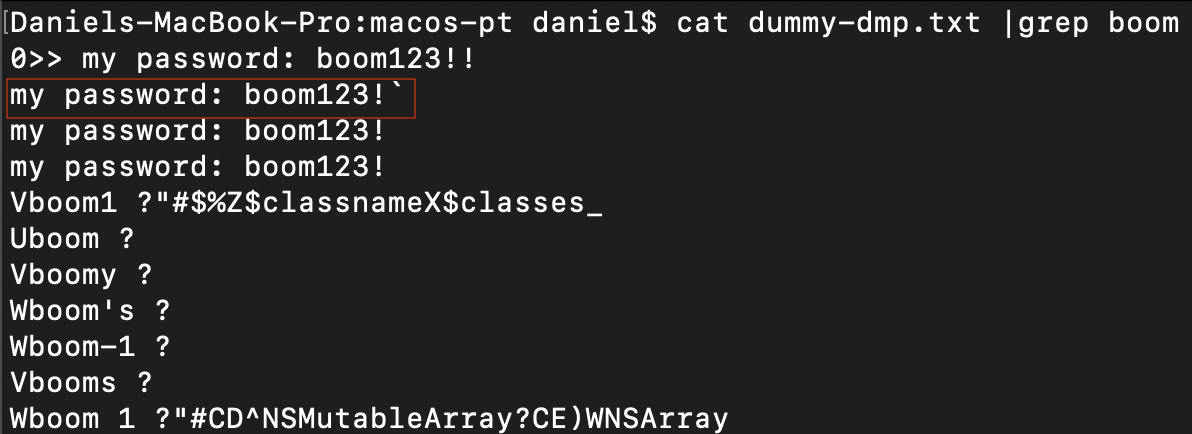
Figure 14: Example for search in the strings file
Also, we can load the application’s binary into lldb and use various commands to get information about the running process. For example, we can use the process status command to show the status and stop location for the current target process (Figure 15), the thread list prints the list of all threads in the process, and the image list lists the loaded images in the process.
To examine the application’s memory, we can use the memory read to read the memory at a specific address or range of addresses. This can be useful for analyzing the values of variables or data structures in the application’s memory. Additionally, we can use the disassemble command to disassemble the code at a specific address or range of addresses, which can help us understand how the application works and potentially identify vulnerabilities like known memory corruption bugs.
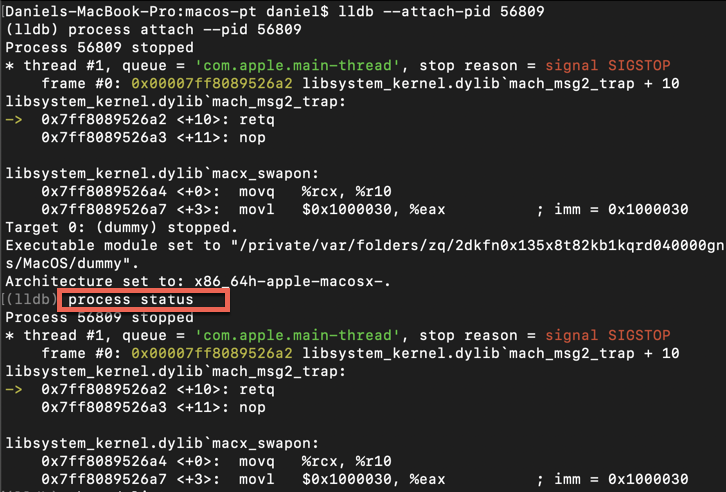
Figure 15: Process status of dummy application
Another powerful tool for memory analysis is DTrace. It can be used to analyze the memory usage of applications. Here is an example of using DTrace for memory analysis:
- First, you must find the application’s process ID (PID) you want to analyze. You can do this by running the following command: ps aux | grep <application name>.
- With the PID in hand, you can attach DTrace to the target process using the following command: sudo dtrace -n ‘pid$target::malloc:entry { trace(arg0); }’ -p <PID>.
This command runs a DTrace script that traces the malloc function calls in a specific process. When the malloc function is called, the script prints the address of the allocated memory (Figure 16).
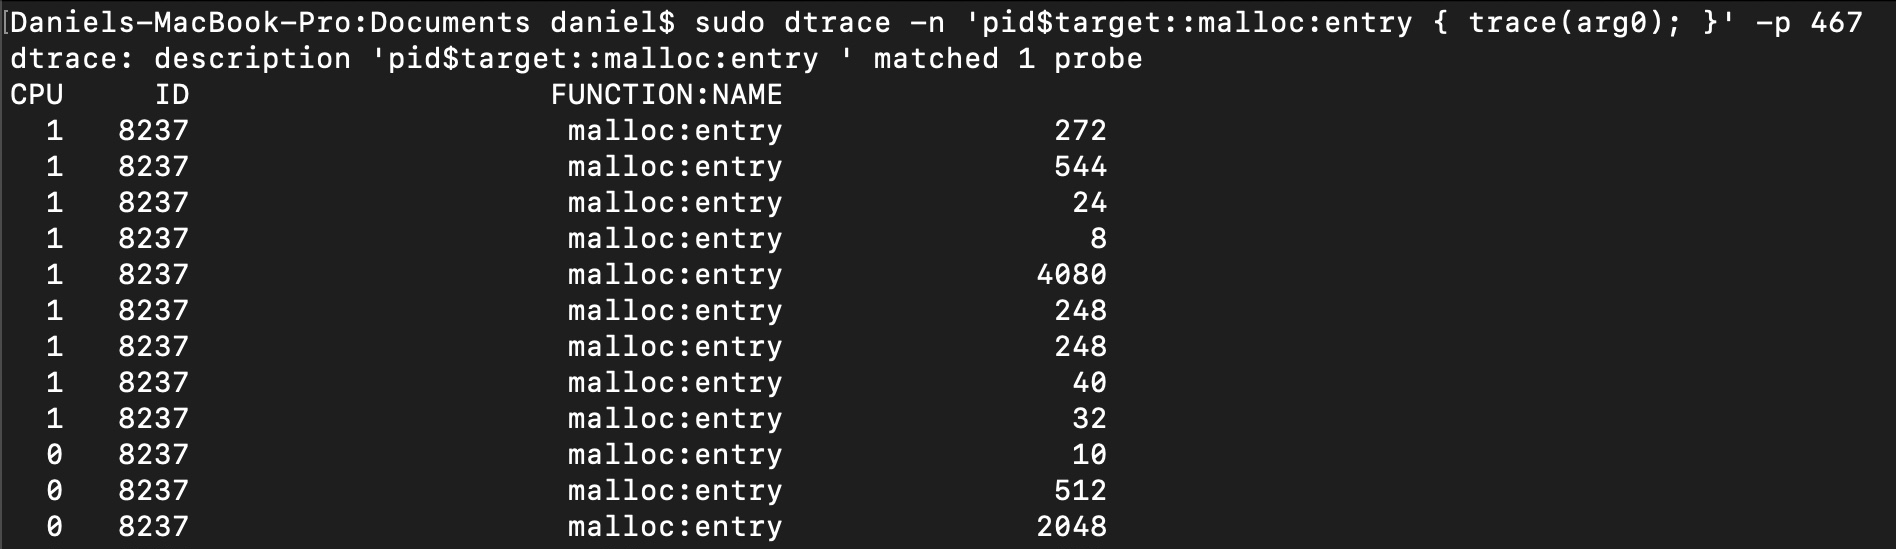
Figure 16: Tracing dummy app “malloc” functions calls
You can modify the DTrace script to capture more data. For example, you could modify the script to track memory allocations by size or print out stack traces for each allocation. For more information, you can visit that ref.
Note that DTrace is a powerful tool; you should use it carefully. Be sure to test your DTrace scripts on a test system before running them on a production system and always ensure you have a backup of important data.
Summary
In this part of our blog series, we discussed the code signing mechanism and code signature flags. Additionally, we covered several file and memory analysis techniques and tools. In the next part, we will delve into client-side attacks, explaining dylib injection and dylib hijacking and other types of attacks.
References:
- https://developer.apple.com/documentation/security/code_signing_services
- https://sec.okta.com/articles/2018/06/issues-around-third-party-apple-code-signing-checks
- https://developer.apple.com/documentation/security/hardened_runtime?language=objc
- https://developer.apple.com/documentation/bundleresources/entitlements
- https://www.newosxbook.com/tools/jtool.html
- https://objective-see.org/tools.html
- https://frida.re
- https://dtrace.org/blogs/brendan/2011/02/11/dtrace-pid-provider-arguments/


