

In this article, we’ll present a new hooking technique that we have found during our research work.
Hooking techniques give you the control over the way an operating system or a piece of software behaves. Some of the software that utilizes hooks include: application security solutions, system utilities, tools for programming (e.g. interception, debugging, extending software, etc.), malicious software (e.g. rootkits) and many others.
Please note, this is neither an elevation nor an exploitation technique. This technique is intended for post-exploitation scenario where the attacker has control over the asset. Since malicious kernel code (rootkits) often seeks to establish persistence in unfriendly territory, stealth technology plays a fundamental role.
Technical Description
The GhostHook technique we discovered can provide malicious actors or information security products with the ability to hook almost any piece of code running on the machine.
Let’s start by explaining the primary technology involved in this technique, Intel® PT:
Intel® Processor Trace (Intel PT) is an extension of Intel® Architecture that captures information about software execution using dedicated hardware facilities that cause only minimal performance perturbation to the software being traced.
This information is collected in data packets. The initial implementations of Intel PT offer control flow tracing, which generates a variety of packets to be processed by a software decoder.
The packets include timing, program flow information (e.g. branch targets, branch taken/not taken indications) and program-induced mode related information (e.g. Intel TSX state transitions, CR3 changes). These packets may be buffered internally before being sent to the memory subsystem or another output mechanism that is available in the platform.
Debug software can process the trace data and reconstruct the program flow. Here’s a list of a change-of-flow instructions which Intel PT traces:
| Type | Instructions |
| Conditional Branch | JA, JAE, JB, JBE, JC, JCXZ< JECXZ, JRCXZ, JE, JG, JGE, JL, JLE, JNA, JNAE, JNB, JNBE, JNC, JNE, JNG, JNGE, JNL, JNLE, JNO, JNP, JNS, JNZ, JO, JP, JPE, JPO, JS, JZ, LOOP, LOOPE, LOOPNE, LOOPNZ, LOOPZ |
| Unconditional Direct Branch | JMP (E9 xx, EB xx), CALL (E8 xx) |
| Indirect Branch | JMP (FF /4), CALL (FF /2) |
| Near Ret | RET (C3, C2 xx) |
| Far Transfers | INTn, INTO, IRET, IRETD, IRETQ, JMP (EA xx, FF /5), CALL (9A xx, FF /3), RET (CB, CA xx), SYSCALL, SYSRET, SYSENTER, SYSEXIT, VMLAUNCH, VMRESUME |
Intel PT was initially released as part of “Broadwell” (5th-generation) CPU and was expanded on “Skylake” (6th-generation) CPU.
So basically, Intel PT provides low overhead hardware that executes tracing on each hardware thread using dedicated hardware (implemented entirely in hardware) in the CPU’s Performance Monitoring Unit (PMU). Intel PT can trace any software the CPU runs including hypervisors (except for SGX secure containers).
This technology is primarily used for performance monitoring, diagnostic code coverage, debugging, fuzzing, malware analysis and exploit detection.
There are three types of tracing:
- Tracing of the entire user-mode/kernel-mode (current privilege level).
- Tracing a single process (Page Map Level 4).
- Instruction Pointer tracing, and this is what we will take advantage of.
To enable tracing, all you have to do is set the proper values inside the IA32_RTIT MSRs according to the tracing type.
Although this technology can be used for legitimate, valuable purposes, one can also take advantage of the buffer-is-going-full notification mechanism to try to take control of a thread’s execution.
The basis of this proposed technique is to make the CPU branch to our piece of code. How can we achieve that with Intel PT?
- Allocate an extremely small buffer for the CPU’s PT packets.
This way, the CPU will quickly run out of buffer space and will jump the PMI handler.
The PMI handler is a piece of code controlled by us and will perform the “hook”.
The PMI handler is invoked when the buffer is full or about to be full and can be registered via:
HalSetSystemInformation(HalProfileSourceInterruptHandler, sizeof(PMIHANDLER), (LPVOID)&hookroutine);
- Start the Intel PT to trace a critical range of code in the kernel. For example, the LSTAR MSR, which is the system-call entry point of the kernel. It’s address can be obtained as follows:
ULONG64 LSTAR = ((ULONG64(*)())"\xB9\x82\x00\x00\xC0\x0F\x32\x48\xC1\xE2\x20\x48\x09\xD0\xC3")();
This will produce a naked function with the following instructions:
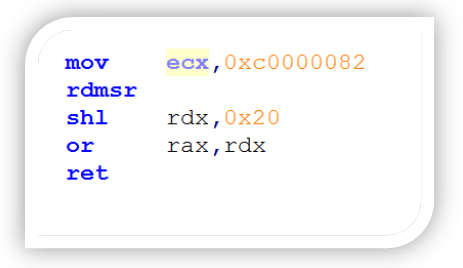
As mentioned, LSTAR is the kernel’s RIP SYSCALL entry (MSR entry 0xc0000082) for 64-bit software.
So basically, we will intercept the nt!KiSystemCall64 function, which is the entry point for service functions on Windows, until the end of the nt!KiSystemServiceUser.
Once a user-mode (SYSCALL) or a kernel-mode (ZW functions) thread will branch inside this code region, the CPU will trace its execution.
- As mentioned before, we are allocating a tiny buffer for the CPU to get it filled almost immediately. We can also use the PTWRITE instruction to make it more precise. PTWRITE will allow us to write data to a processor trace packet, and once the buffer is full, the CPU will interrupt the execution and will call the PMI handler (controlled by us) in the context of the running thread. It is possible to completely alter the execution context at this point, which is exactly the same as what one could do via traditional opcode-replacement-based patching for a given location. Proof of Concept:
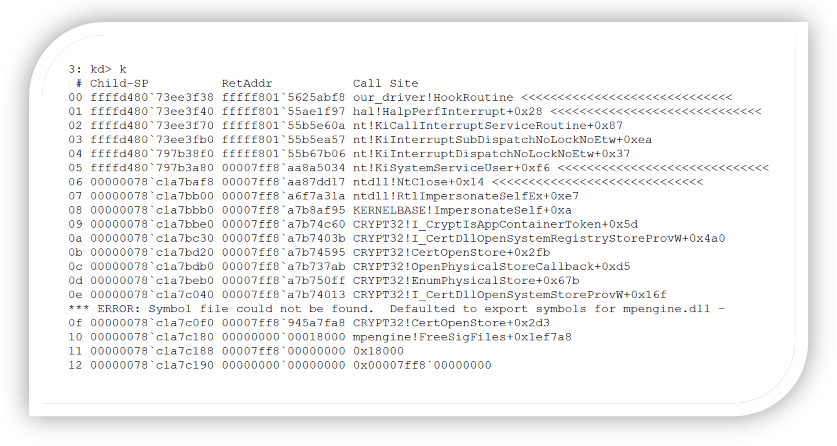
The technique described above, in the current implementation, will result in a race-condition manner. This stack trace demonstrates hooking the service function nt!NtClose, called by a user-mode application.
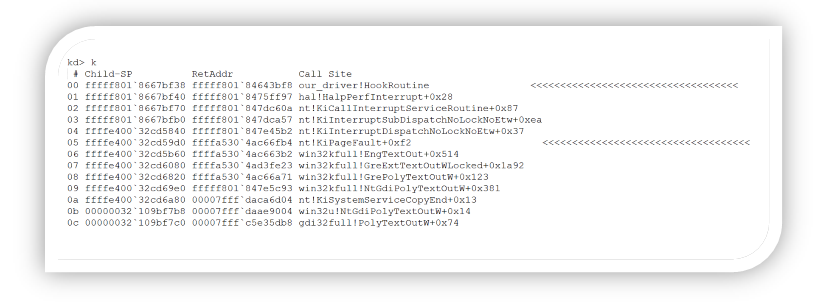
The same thing can be done for example to an IDT routine:
Registering to PMI is transparent to the current PatchGuard implementation. Because this technique uses hardware to gain control of a thread’s execution and kernel code/critical kernel structures aren’t being patched, it would be extremely difficult for Microsoft to detect and defeat this technique. Thus, the proposed method should be preferable (despite adding significant complexity to the implementation). Moreover, the suggested technique should be future proof and reliable across kernel versions.
Microsoft’s response:
“The engineering team has finished their analysis of this report and determined that it requires the attacker already be running kernel code on the system. As such, this doesn’t meet the bar for servicing in a security update however it may be addressed in a future version of Windows. As such I’ve closed this case.”
Microsoft does not seem to realize that PatchGuard is a kernel component that should not be bypassed, since PatchGuard blocks rootkits from activities such as SSDT hooking, not from executing code in kernel-mode.


