

Introduction
With fileless malware becoming a ubiquitous feature of most modern Red Teams, knowledge in the domain of memory stealth and detection is becoming an increasingly valuable skill to add to both an attacker and defender’s arsenal. I’ve written this text with the intention of further improving the skill of the reader as it relates to the topic of memory stealth on Windows for both designing and defending against such malware. First, I will first introduce my pseudo-malicious memory artifacts kit tool (open source on Github here). Second, using this tool I will investigate the weak points of several defensive scanners. Finally, I will explore what I deem to be the most valuable stealth techniques and concepts from an attack perspective based on the results of this investigation.
This is the third in a series of posts on malware forensics and bypassing defensive scanners. It was written with the assumption that the reader understands the basics of Windows internals, memory scanners and malware design.
Corpus
In order to accurately measure the efficacy of the scanners discussed in this text, I’ve constructed a modular pseudo-malware artifact generator program, which I refer to throughout this text as my artifact kit. It generates a myriad of dynamic shellcode and PE implants in memory, covering all of the most common and effective fileless memory residence techniques used by real malware in the wild. In this sense, while the actual shellcode or PE implant itself may not match that of a real malware sample, the attributes of the memory that encapsulates it are intended to mimic the attributes of every real malware that can or does already exist, whether they are performing process injections, process hollowing or self-unpacking.
Similar to the modular/dynamic method of generating custom process injections by mixing and matching allocation methods, copy methods and execution methods implemented by FuzzySec and integrated into SharpSploit, the artifact kit in this text mixes and matches different memory allocation, code implant and stealth techniques to mimic the dynamic code operations made in fileless malware.
The memory allocation types handled in this corpus are as follows:
- Mapped image hollowing – a DLL of sufficient size to accommodate the payload code is used to create an image section via DLL!NtCreateSection with SEC_IMAGE, a view of which is then mapped into the target process using NTDLL.DLL!NtMapViewOfSection. In the part one of this series this is referred to as DLL hollowing.
- Mapped TxF image hollowing – a transacted file handle is opened to a DLL and used to create a phantom image section from it with DLL!NtCreateSection with SEC_IMAGE, which is then mapped into the target process using NTDLL.DLL!NtMapViewOfSection. In the part one of this series this is referred to as phantom DLL hollowing.
- Loaded image hollowing – a DLL is loaded normally using DLL!LdrLoadDll.
- Private memory – allocated using DLL!NtAllocateVirtualMemory
- Mapped memory – allocated by mapping a view of a section created from the page file using DLLNtCreateSection.
Each of these allocation types can be used with either a shellcode or PE payload as their implant type. In cases where a variation of DLL hollowing is used as the allocation type in conjunction with shellcode, an appropriate implant offset within the .text section that does not conflict with relocations or data directories will be chosen for it.
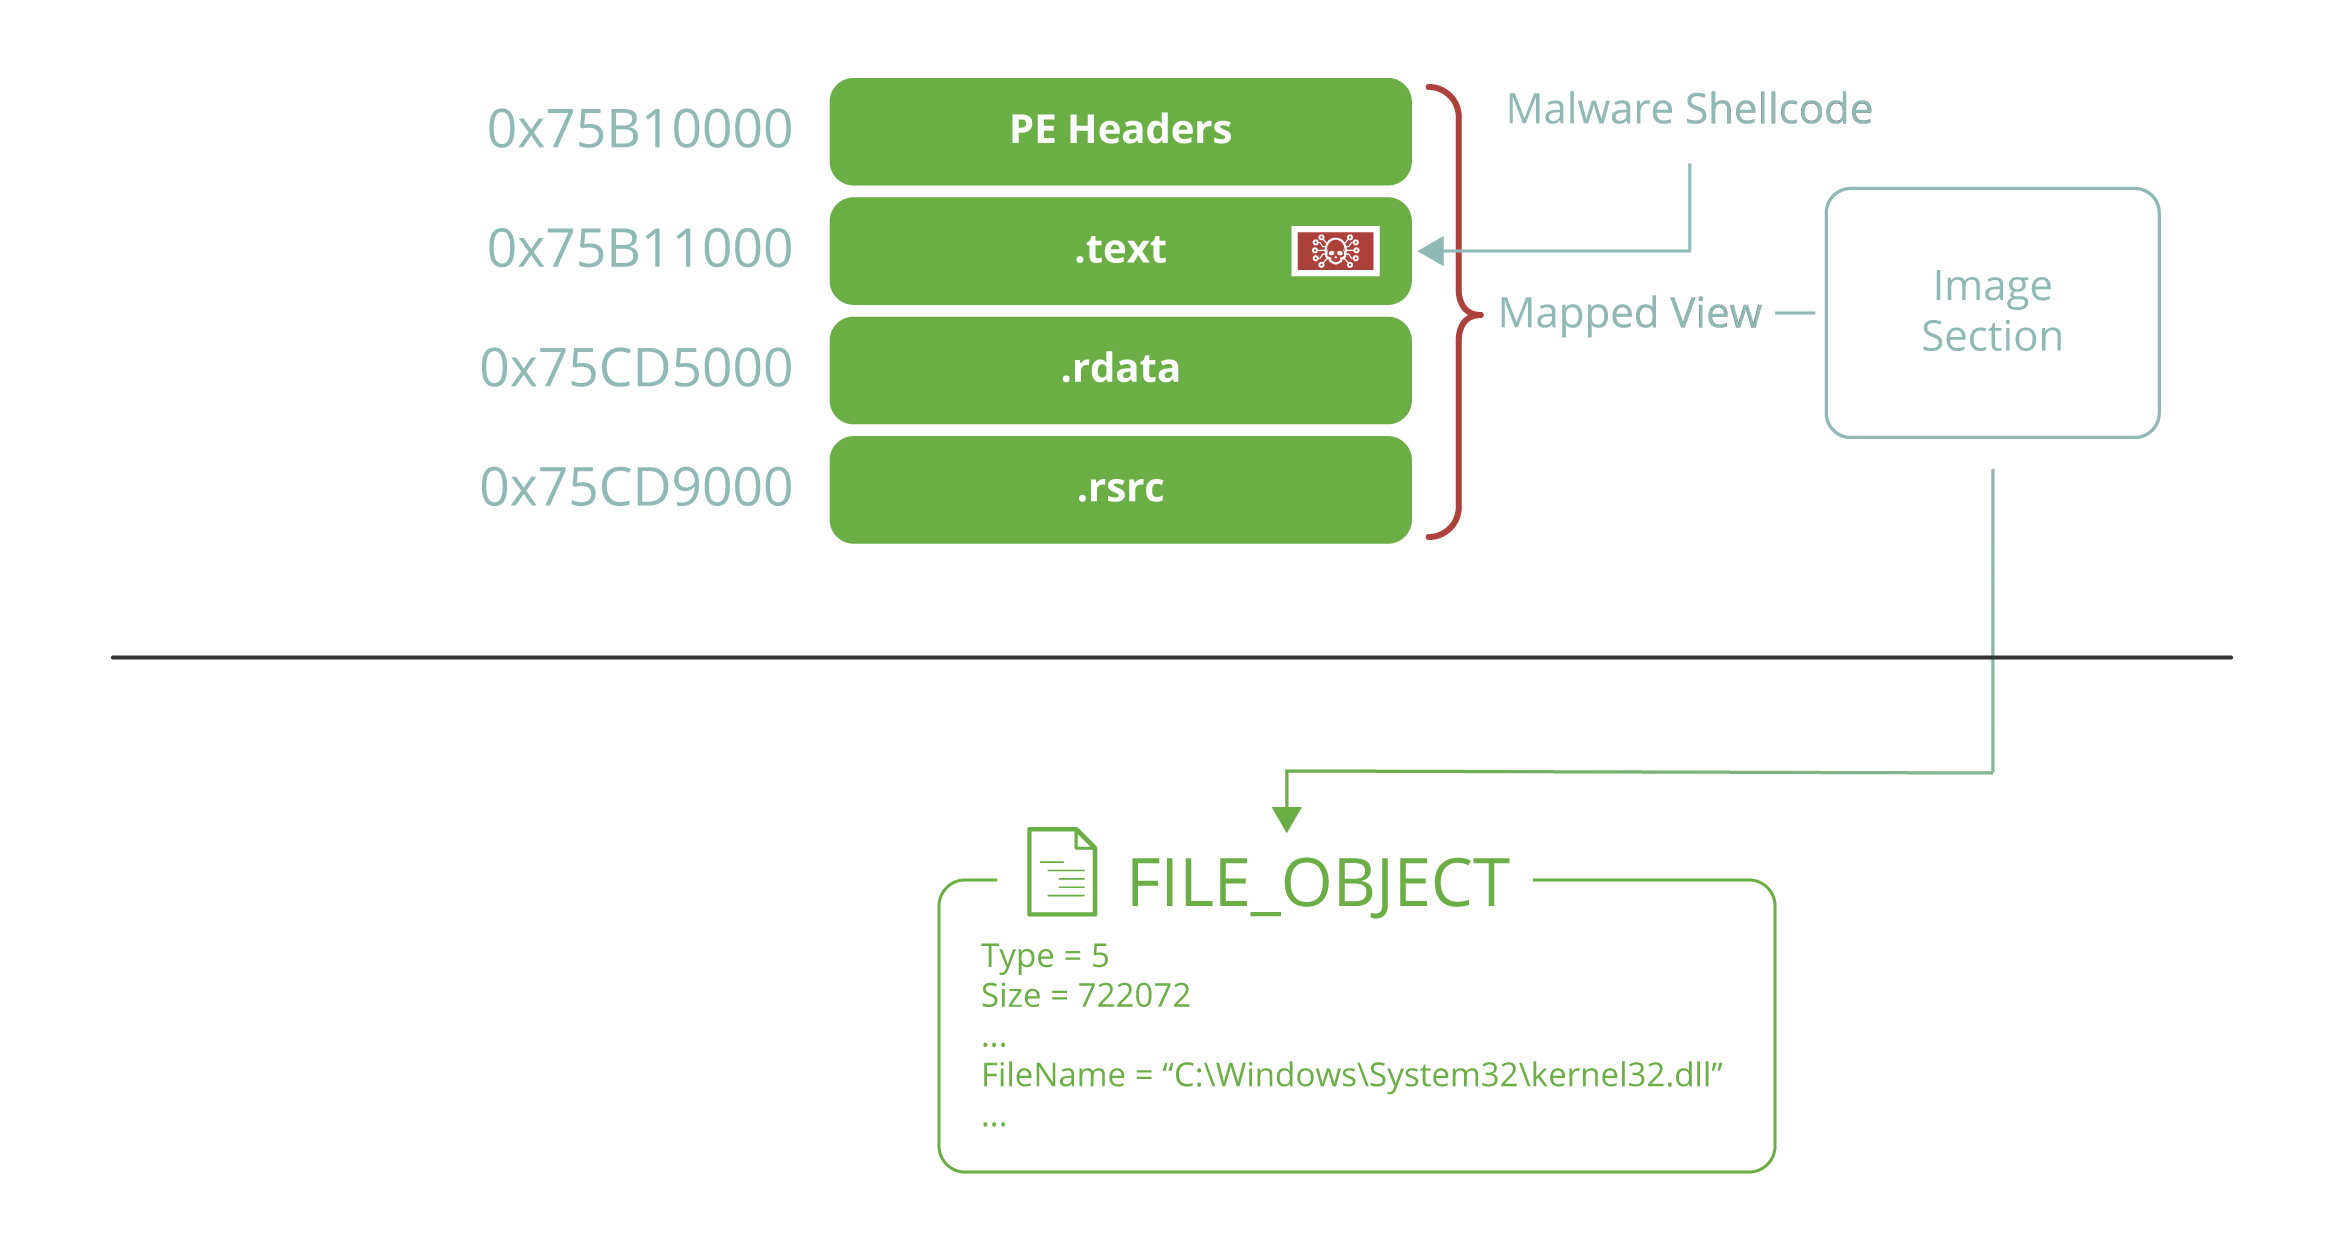 Figure 1. A hollowed Kernel32.dll image with a malicious shellcode implanted in its code section.
In all allocation types where a PE payload is used, the PE will be directly written to the base of the region and bootstrapped (relocations applied, IAT resolved, etc.).
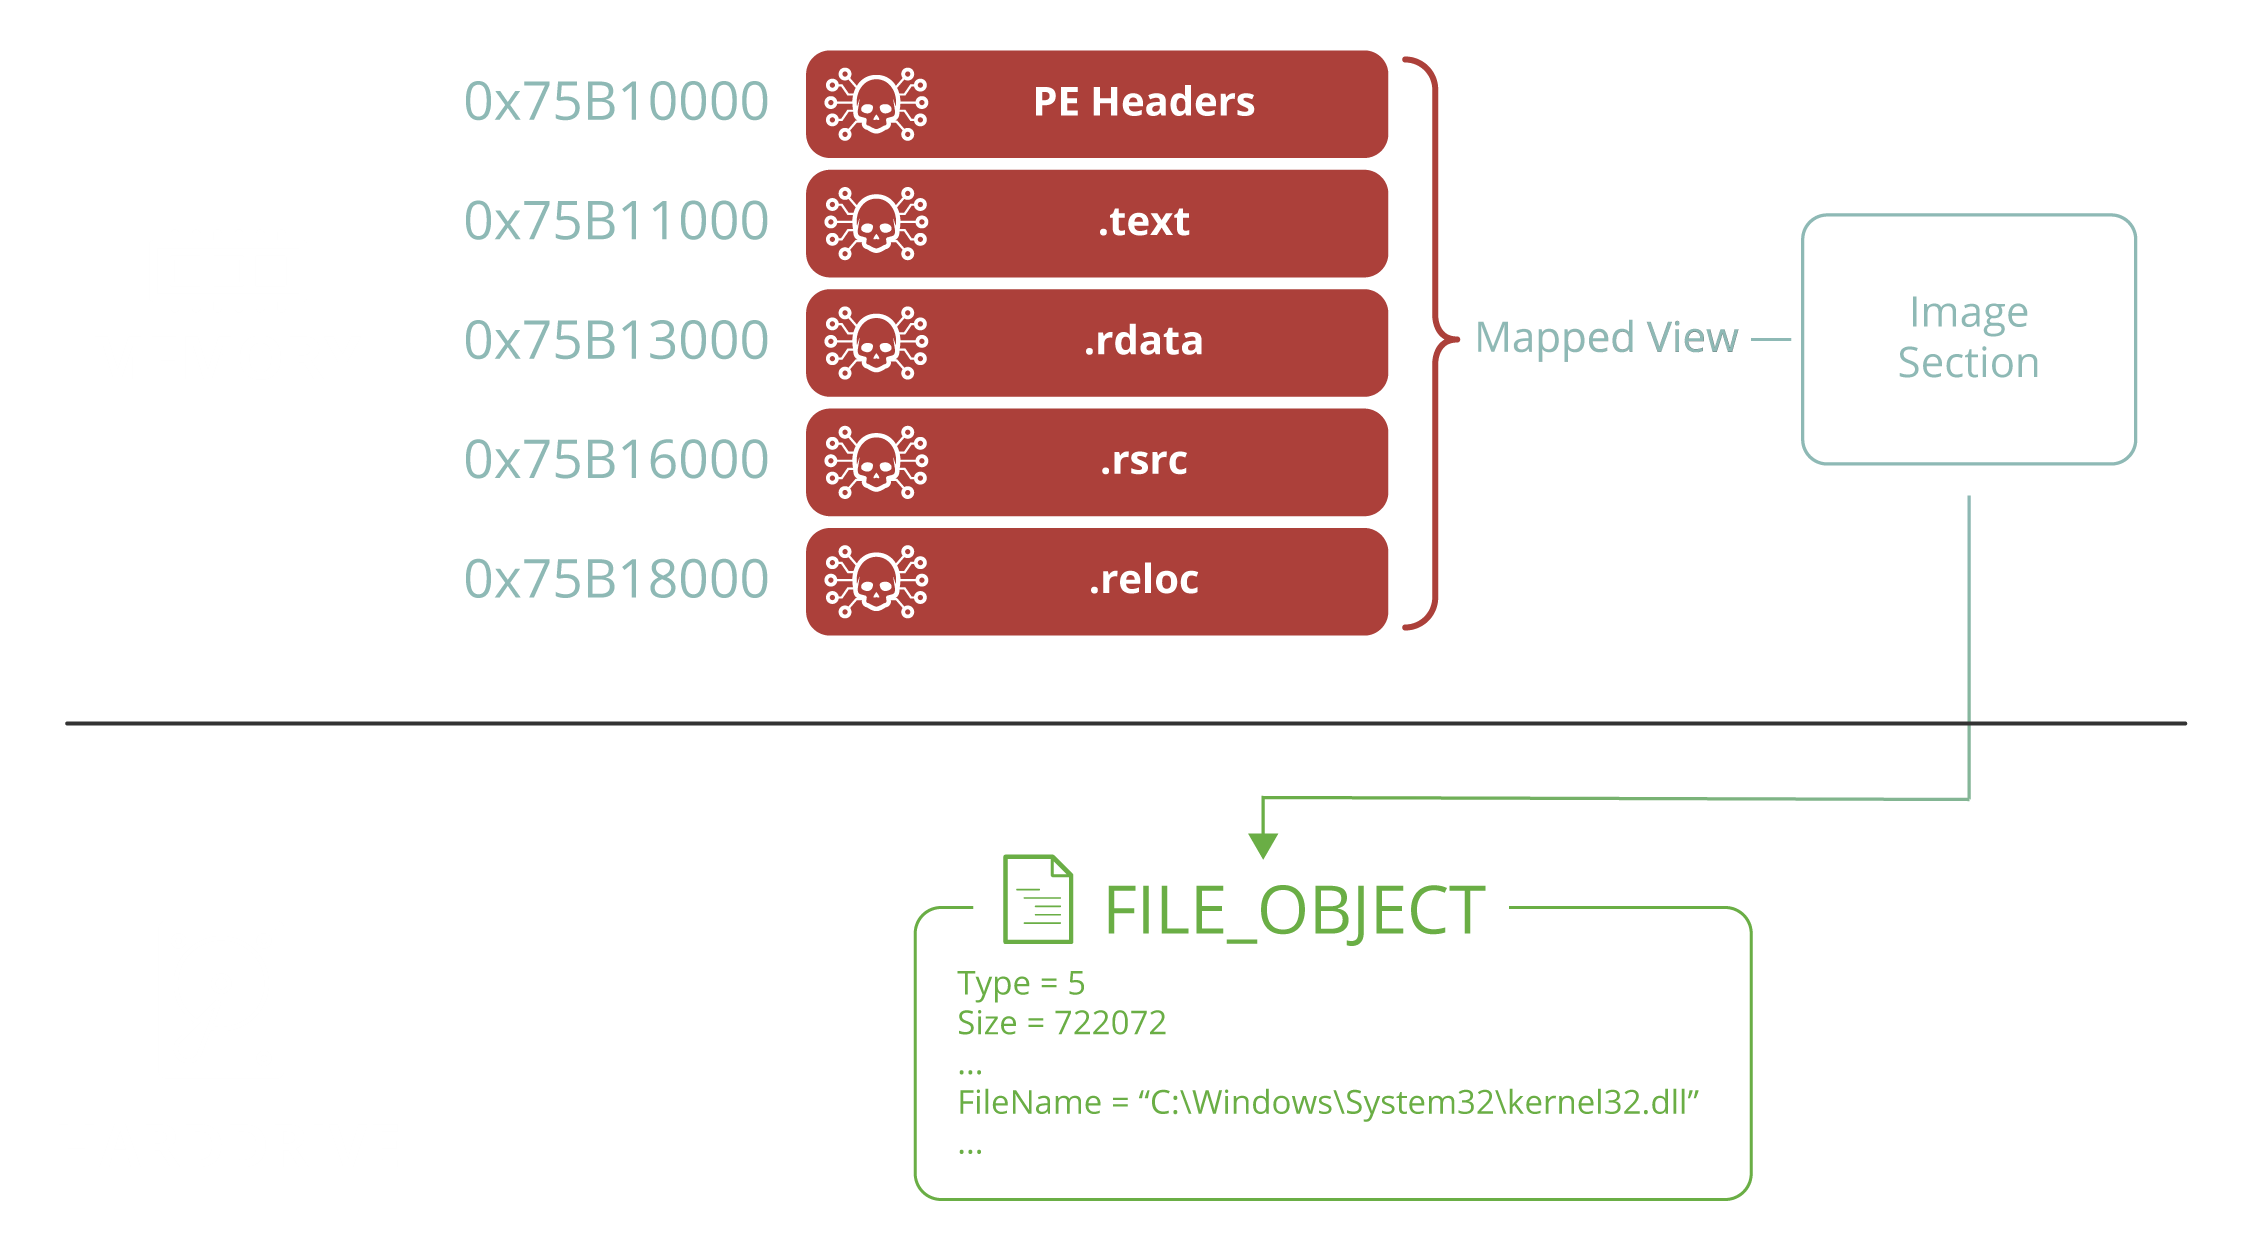 Figure 2. A hollowed Kernel32.dll image overwritten with a malicious PE implant.
In conjunction with all of these different allocation and payload types, one or more stealth techniques can, optionally, be applied:
- Header wiping – in the event a PE payload is used, its header will be overwritten with 0’s.
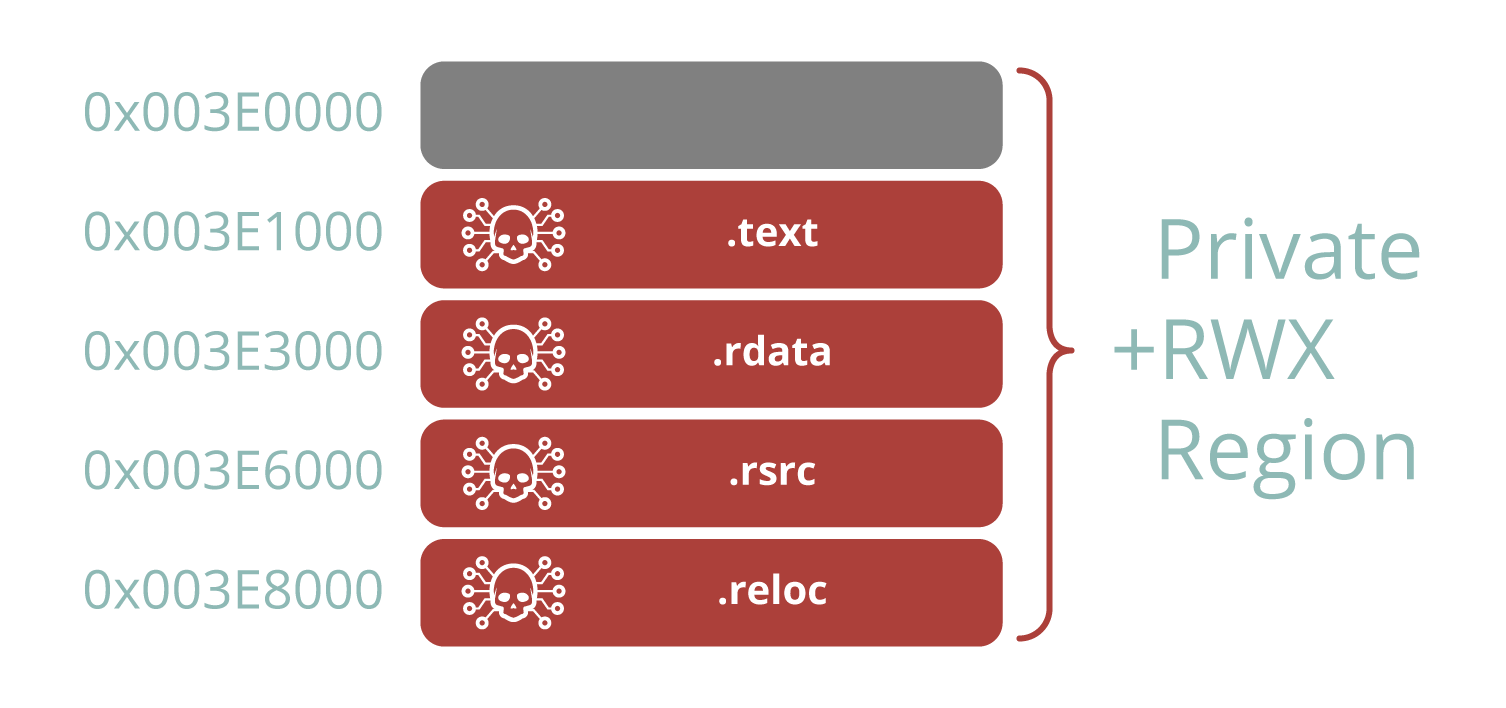 Figure 3. A malicious PE implant stored in private memory that has had its headers wiped.
- Header mirroring – in the event a PE payload is used in conjunction with a variation of DLL hollowing, the header of the original DLL file underlying the hollowed section will be preserved.
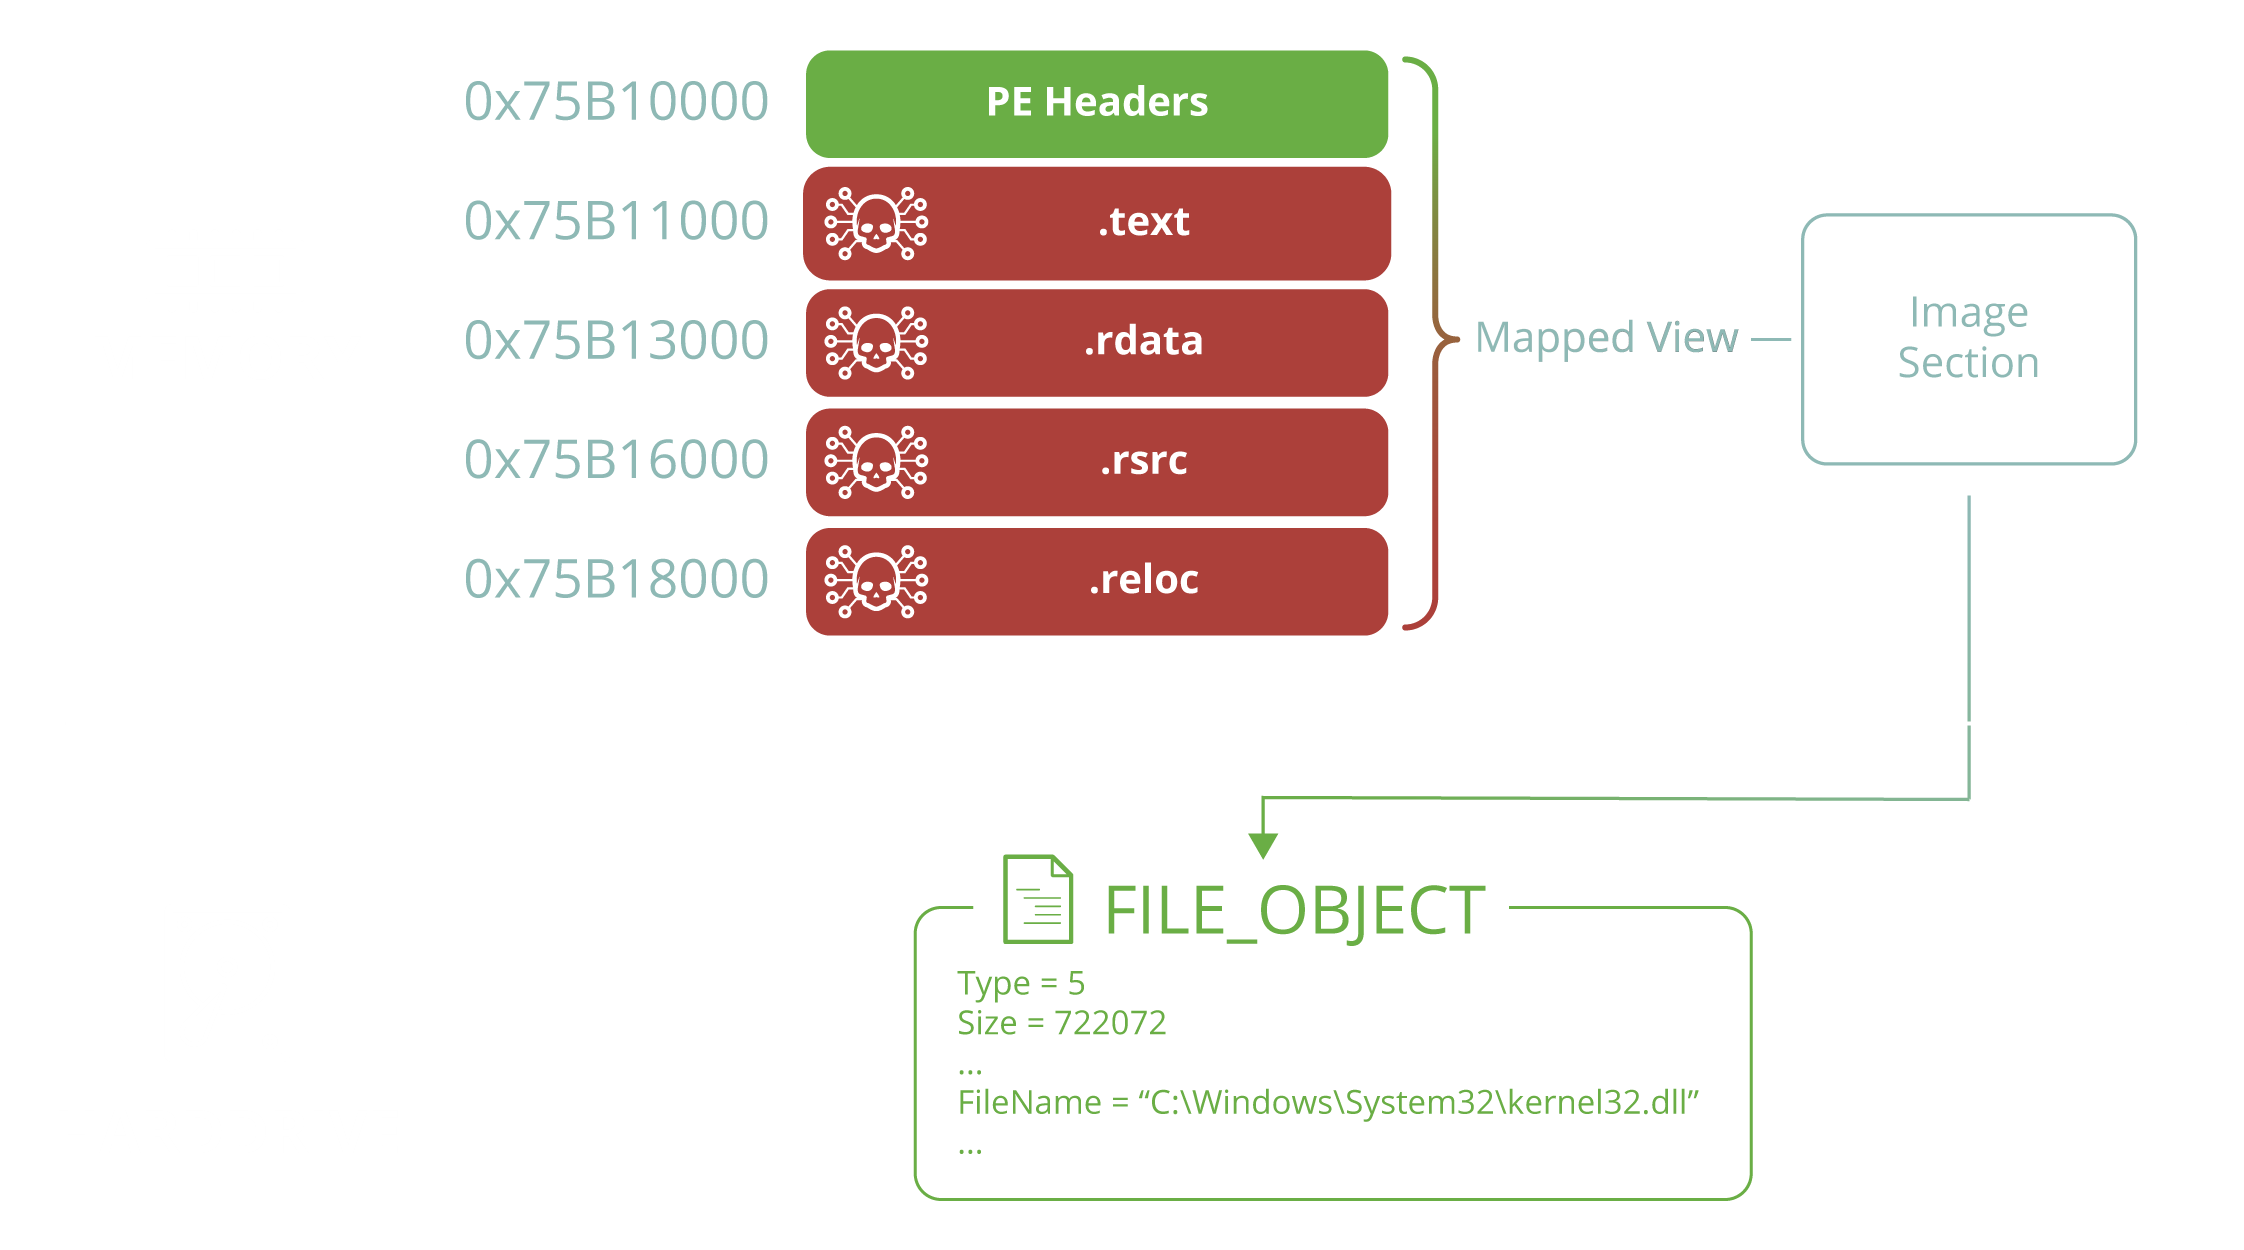 Figure 4. A hollowed Kernel32.dll image has had its original headers preserved.
- RW -> RX – In the event that private or mapped allocation is used, it will initially be allocated as +RW permissions (+RWX is the default) and then modified to +RX after the implant has been written using NTDLL.DLL!NtProtectVirtualMemory.
- Dotnet – In the event that a variation of DLL hollowing is selected as the allocation type, only PE DLLs with a .NET data directory will be selected.
- Moating – allocated memory, regardless of its type, will require additional memory equal to the size of the “moat” (default of 1MB). When the implant is written to the new region, it will be written at an offset equal to the size of the moat; the data prior to which will be junk.
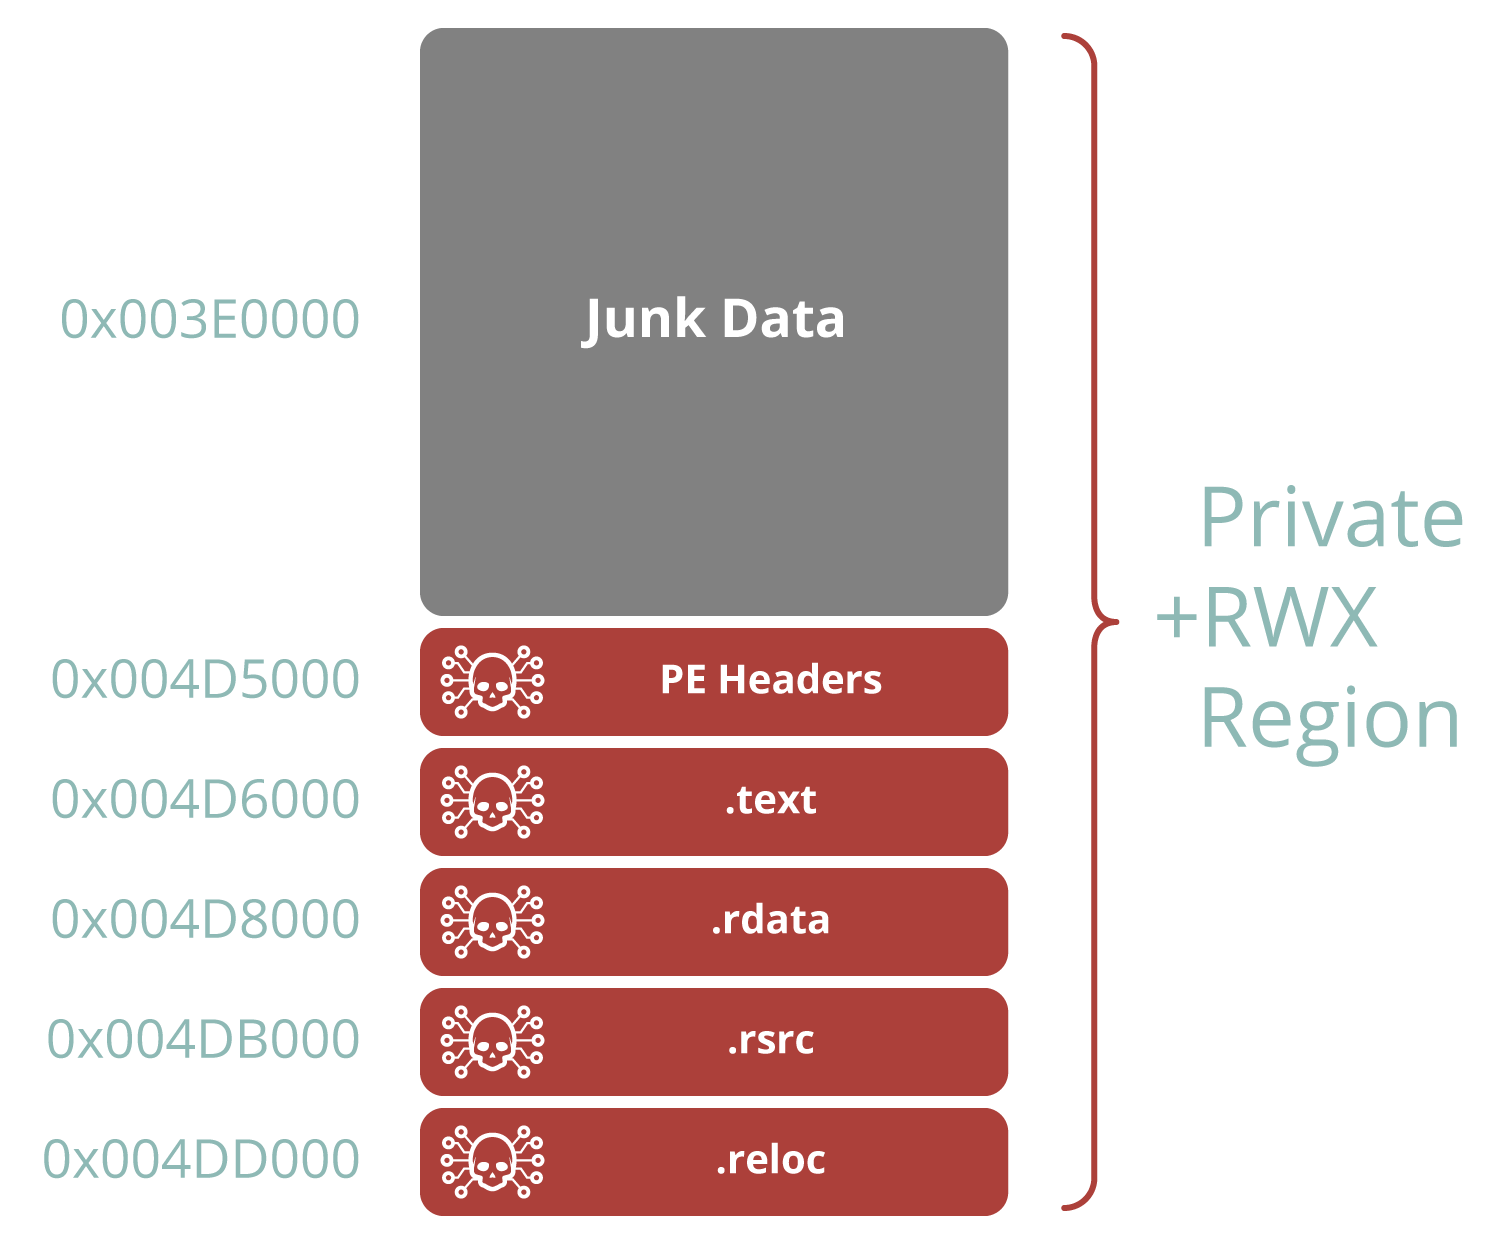 Figure 5. A malicious PE implant has been placed at an offset one megabyte deep into an allocated region of private +RWX memory.
Finally, the artifact kit allows the user to specify an execution method. This is the method by which execution control is passed to the payload after its container region has been created, its implant finished and its obfuscations finalized. This may be either:
- A new thread with the use of the KERNEL32.DLL!CreateThread API.
- A JMP hook placed on the entry point of the primary EXE module (which is called by the artifact kit to simulate the type of hook often used in process hollowing).
- A direct assembly CALL instruction. This distinction between execution method has great significance, as the starting point of a thread and modification of existing image memory are some of the many artifacts a scanner may leverage to form an IOC, as we will explore later.
An example of the practical usage of the artifact kit is as follows: we would like to mimic the memory artifacts generated by the loader of the Osiris malware family. I suggest reading this analysis of the Osiris loader prior to reading the remainder of this section. This loader begins by using the Lagos Island method in order to bypass hooks on ntdll.dll. We can artificially generate an identical artifact using the artifact kit:
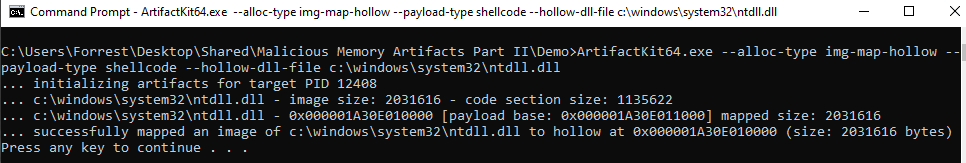 Figure 6. Artifact kit mimicking Lagos Island technique by mapping ntdll.dll using its hollowing feature without writing an implant to it.
Using my tool Moneta (explored in detail in part two of this series) the memory of the artifact process is enumerated and the authentic/original ntdll.dll loaded via static imports at process startup can be seen at 0x00007FFEF4F60000 without IOCs:
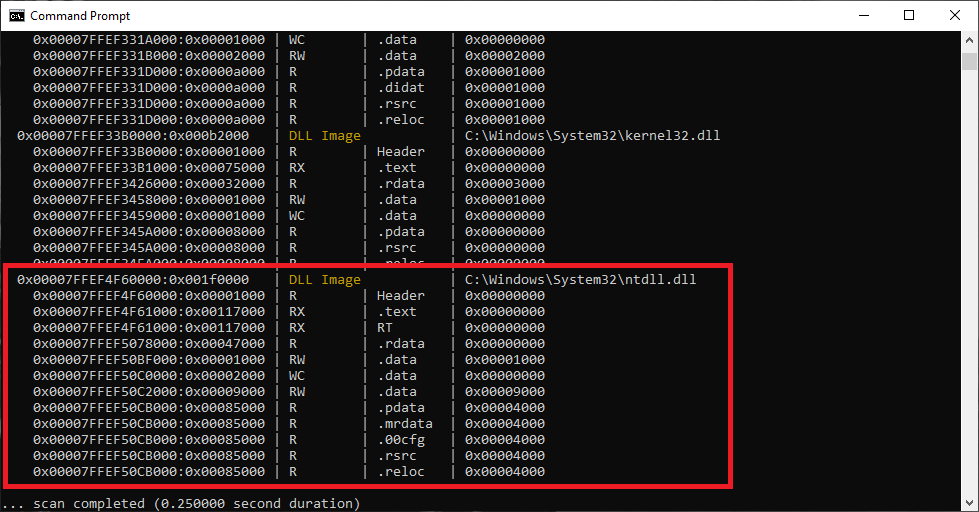 Figure 7. Moneta enumerating the memory within the artifact process – the real ntdll.dll
Examining the memory scan output in further detail, a second ntdll.dll can be seen at 0x000001A30E010000. Notably, this ntdll.dll shows a missing PEB module IOC. This is because the Lagos Island method (as well as the hollower in the artifact kit) use NTDLL.DLL!NtCreateSection and NTDLL.DLL!NtMapViewOfSection rather than NTDLL.DLL!LdrLoadDll. This results in an image backed by the authentic ntdll.dll on disk being created in memory, but no corresponding entry for it being created in the PEB loaded modules list. This is an abnormality unique to Lagos Island, DLL hollowing and some usermode Rootkits that intentionally unlink themselves from the PEB to bypass scanners that rely on this list for their usermode process enumeration.
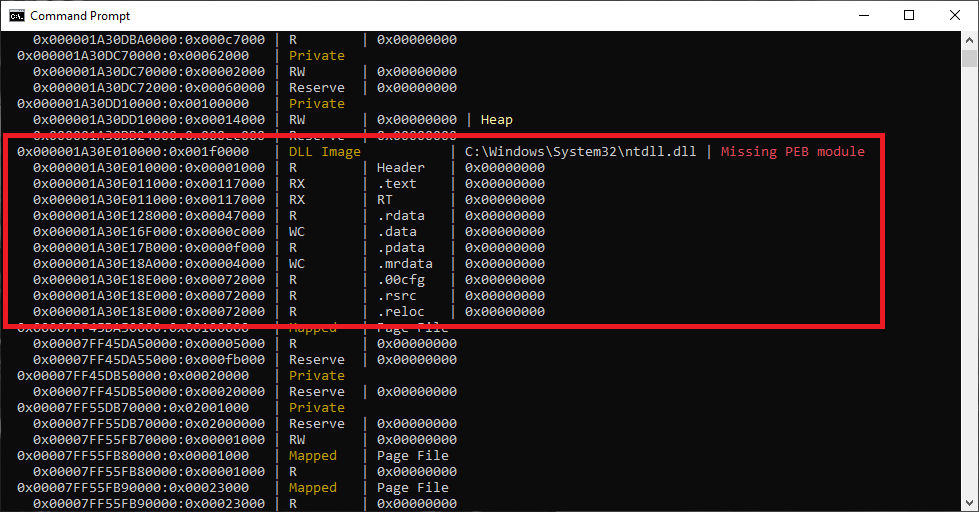 Figure 8. Moneta enumerating the memory within the artifact process – the orphaned clone of ntdll.dll.
Using the hook-free Lagos Island ntdll.dll clone, Osiris then activates its process hollowing routine which launches a signed wermgr.exe in suspended mode. Next, it creates a file in %TEMP% that holds its payload code using TxF (which prevents it from being scanned by AV when written to disk). A section is generated from the TxF handle to this file and a view of this section is mapped into the suspended wermgr.exe process. The image base in the PEB of wermgr.exe is redirected to this new image memory region and a JMP is written to the entry point of the original wermgr.exe image in memory to achieve code execution, as opposed to using KERNEL32.DLL!SetThreadContext (typically the preferred method in process hollowing). Simply resuming the suspended wermgr.exe process causes the malicious payload to be executed.
In order to generate artifacts that will mimic this loader behavior and simulate the IOC contents of wermgr.exe, the artifact kit can be used to execute a PE payload using TxF image map hollowing as its allocation method, while using a JMP from the process entry point as its execution method.
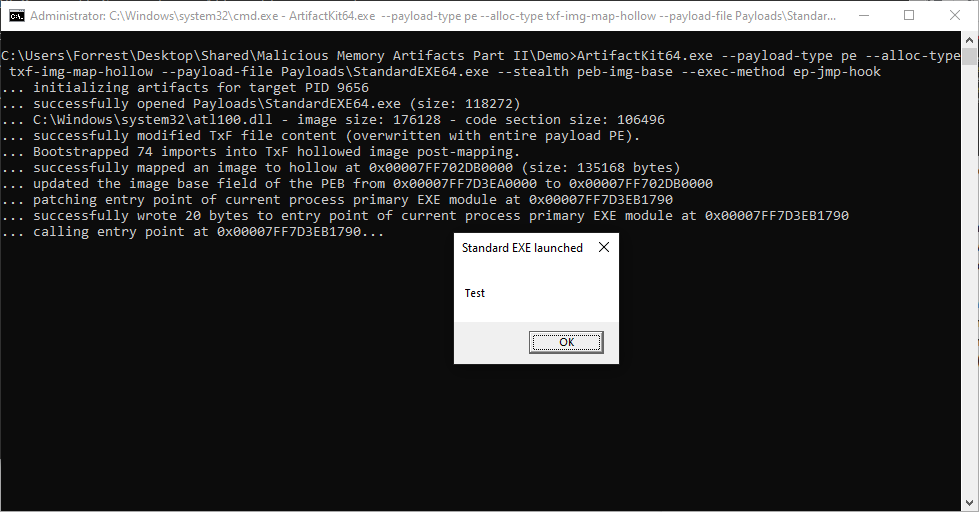 Figure 9. Artifact kit mimicking Osiris process hollowing via phantom DLL hollowing.
Scanning the artifact process using Moneta, the suspicious Osiris artifacts become easy to distinguished from legitimate memory:
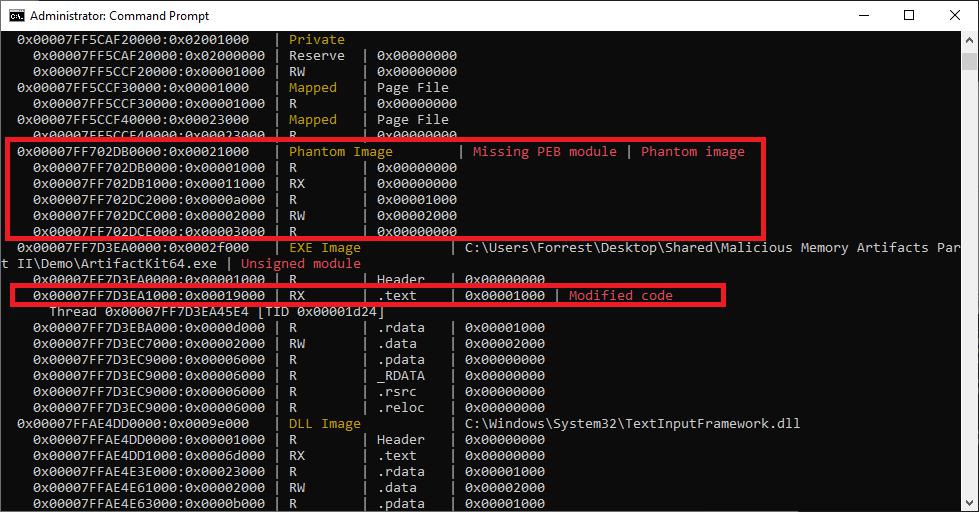 Figure 10. Moneta enumerating the artifact memory within the artifact process – phantom DLL hollowing in conjunction with an inline hook.
The first of the two IOCs above (enumerated in the first highlighted region) are a result of the technique that Osiris uses to do its hollowing. Due to the module containing the malicious code being mapped into the target process using TxF, its file object is non-queryable from the context of an external process, leading Moneta to classify it as a phantom module and marking it as an IOC. Secondly, due to this phantom module being manually mapped via NTDLL.DLL!NtMapViewOfSection, rather than legitimately using NTDLL.DLL!LdrLoadDll, it has not been added to the loaded modules list in the PEB, leading to an IOC stemming from the lack of a PEB module corresponding to the base address of 0x00007FF702DB0000 associated with the mapped image region.
The third and final IOC (enumerated in the second highlighted region in Figure 10) corresponds to the .text section of the primary EXE module of the artifact process (in this case ArtifactKit64.exe itself) at 0x00007FF7D3EA1000. In the final column to the right-hand side of the highlighted region, the value of 0x1000 is displayed alongside the +RX region in .text. This is a measure of the number of private bytes in the working set associated with the memory region. For any +RX region (including the .text section), this value should always be 0, since the memory was not intended to be writable and should contain only static (as opposed to dynamic) code. I suggest reading part one of this series for a more in-depth explanation of this phenomenon. The fact that this region has private bytes associated with it comes as a result of the inline hook written to the entry point within the .text section by the artifact kit. This hook triggers a modified code IOC in imitation of the artifacts that would result from a process hollowing operation of the Osiris loader.
The example provided above illustrates how the artifacts kit is able to mimic the memory footprint of real malware. In order to conduct the research described throughout the remainder of this text, the artifacts kit was used to generate every possible combination of memory allocation, obfuscation and implant types in combination with one another. The resulting artifacts were scanned with a series of defensive memory scanners to determine their visibility. The remainder of this text will focus on the insights gained from these scans and their wider implications when designing malware.
Malfind
The Volatility framework serves as the backbone for many of the popular malware memory forensic scanners in use today. It makes use of a kernel mode driver in order to directly query usermode memory, primarily relying upon VADs for its analysis. Best known among these memory scanner plugins is Malfind, a plugin which exists both in the classic Volatility framework as well as Rekall (a similar project that began as a fork of Volatility).
For a set of initial tests, I used the artifact kit to generate six variations of empty memory allocations without malicious implants to understand on a basic level which types of allocations Malfind considers suspicious.
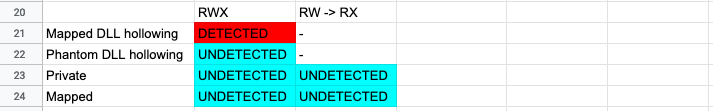 Figure 11. Malfind detection results for blank artifact kit allocation types.
These results are somewhat surprising in that they illustrate a lack of detection for what would commonly be considered the most suspicious type of memory allocation, private +RWX regions. In contrast, a PAGE_EXECUTE_WRITECOPY allocation (Malfind doesn’t differentiate between this and +RWX) of image memory corresponding to a DLL that has been manually mapped rather than loaded via NTDLL.DLL!LdrLoadDll is detected. An explanation for why private +RWX is not detected in this case can be seen in Figure 12 below.
def _is_vad_empty(self, vad, address_space):
    """
    Check if a VAD region is either entirely unavailable
    due to paging, entirely consiting of zeros, or a
    combination of the two. This helps ignore false positives
    whose VAD flags match task._injection_filter requirements
    but there's no data and thus not worth reporting it.

    @param vad: an MMVAD object in kernel AS
    @param address_space: the process address space
    """

    PAGE_SIZE = 0x1000
    all_zero_page = "\x00" * PAGE_SIZE

    offset = 0
    while offset < vad.Length:
        next_addr = vad.Start + offset
        if (address_space.is_valid_address(next_addr) and
                address_space.read(next_addr, PAGE_SIZE) != all_zero_page):
            return False
        offset += PAGE_SIZE

    return True
Figure 12. Malfind.py lines 37-60 – Blank VAD filter logic within Malfind source code.
This subroutine (as clearly stated in the highlighted region) is used to filter false positives by eliminating any region of memory filled only with 0’s from the results of a malware scan. In our case, the private and mapped +RWX regions allocated by the artifact kit will fall into this category and will thus be eliminated.
An explanation of the second notable result from Figure 11 (the detection of unmodified manually mapped image regions) can be seen in Figure 13 below.
for task in self.filter_processes():
	# Build a dictionary for all three PEB lists where the
	# keys are base address and module objects are the values
	inloadorder = dict((mod.DllBase.v(), mod)
					   for mod in task.get_load_modules())

	ininitorder = dict((mod.DllBase.v(), mod)
					   for mod in task.get_init_modules())

	inmemorder = dict((mod.DllBase.v(), mod)
					  for mod in task.get_mem_modules())

	#Build a similar dictionary for the mapped files
	mapped_files = dict((vad.Start, name)
						for vad, name in self.list_mapped_files(task))

	yield dict(divider=task)

	# For each base address with a mapped file, print info on
	# the other PEB lists to spot discrepancies.
	for base in list(mapped_files.keys()):
		yield dict(_EPROCESS=task,
				   base=base,
				   in_load=base in inloadorder,
				   in_load_path=inloadorder.get(
					   base, obj.NoneObject()).FullDllName,
				   in_init=base in ininitorder,
				   in_init_path=ininitorder.get(
					   base, obj.NoneObject()).FullDllName,
				   in_mem=base in inmemorder,
				   in_mem_path=inmemorder.get(
					   base, obj.NoneObject()).FullDllName,
				   mapped=mapped_files[base])
Figure 13. Malfind.py lines 199-230 – PEB loaded modules list and mapped files being checked for discrepancies in Malfind.
Malfind is generating dictionaries of all three of the linked lists stored in the PEB that provide lists (in different orders) of the loaded modules in the process and cross-referencing their base addresses with the base addresses of “mapped files.” Digging deeper into the list_mapped_files routine, called in the highlighted region, the logic being used for detection becomes more evident:
def list_mapped_files(self, task):
	"""Iterates over all vads and returns executable regions.

	Yields:
	  vad objects which are both executable and have a file name.
	"""
	self.session.report_progress("Inspecting Pid %s",
								 task.UniqueProcessId)

	for vad in task.RealVadRoot.traverse():
		try:
			file_obj = vad.ControlArea.FilePointer
			protect = str(vad.u.VadFlags.ProtectionEnum)
			if "EXECUTE" in protect and "WRITE" in protect:
				yield vad, file_obj.file_name_with_drive()
		except AttributeError:
			pass
Figure 14. Malfind.py lines 178-194 – Executable file mapping enumeration in Malfind.
The list_mapped_files function shown in Figure 14 is looping through all of the regions of committed memory within the process (by allocation base via VAD) and checking to see whether or not they are derived from section objects that are +RWX and tied to valid file paths corresponding to a mounted filesystem. Notably, Malfind is not checking whether the memory is of a mapped or image type, only that it has a file underlying it on disk and that it is +RWX. This has the unintended side-effect of allowing an attacker to bypass this routine by using the page file as their underlying file object when allocating memory of the MEM_MAPPED type.
With this logic in mind, it is clear why our unmapped DLL image triggered a detection despite not containing any malicious code: it has no corresponding entry in the PEB loaded modules list. Therefore, a bypass to this detection would be to use NTDLL.DLL!LdrLoadDll to generate image memory for DLL hollowing rather than NTDLL.DLL!NtCreateSection and NTDLL.DLL!NtMapViewOfSection.
With a solid understanding of why Malfind produced the detections that it did for regions of blank memory, I next tested it against a total of eighteen different sets of artifacts wherein each allocation type was paired with each relevant stealth technique while using a PE as my implant payload:
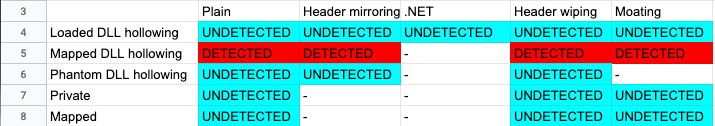 Figure 15. Malfind results from scans of PE implant artifacts.
The results shown in Figure 15 above illustrate a lack of detection for all of the tested artifact variations with the exception of those relying upon image memory derived from manually mapped DLLs (which, as discussed previously, is due to their lack of an entry in the PEB loaded modules list). This is consistent with the results of the blank allocation scans shown in Figure 11; however, it should be noted that the reason the private and mapped implants have not been detected is that they were initially allocated as +RW and later changed to +RX rather than being allocated as +RWX. This same two-stage permission modification process is repeated for all tests relating to private and mapped memory throughout this text unless specified otherwise.
In order to gain better visibility into the detection logic behind the private and mapped regions in these tests, I made a second series of twelve tests utilizing only private/mapped memory, this time each variation was repeated twice: once with the +RW -> +RX permission modification trick, and once with +RWX. The results were unsurprising:
 Figure 16. In-depth private memory artifact results from malfind.
It seems that no matter what stealth (if any) is used within a private +RX region, it will never be detected by Malfind, while, in contrast, all variations of private +RWX memory containing PE implants will be detected by Malfind regardless of the stealth method chosen to hide them. The reason for this is illustrated in the snippet of Malfind source code seen in Figure 17 below.
def _injection_filter(self, vad, task_as):
    """Detects injected vad regions.

    This looks for private allocations that are committed,
    memory-resident, non-empty (not all zeros) and with an
    original protection that includes write and execute.

    It is important to note that protections are applied at
    the allocation granularity (page level). Thus the original
    protection might not be the current protection, and it
    also might not apply to all pages in the VAD range.

    @param vad: an MMVAD object.

    @returns: True if the MMVAD looks like it might
    contain injected code.
    """
    # Try to find injections.
    protect = str(vad.u.VadFlags.ProtectionEnum)
    write_exec = "EXECUTE" in protect and "WRITE" in protect

    # The Write/Execute check applies to everything
    if not write_exec:
        return False

    # This is a typical VirtualAlloc'd injection
    if ((vad.u.VadFlags.PrivateMemory == 1 and
         vad.Tag == "VadS") or

            # This is a stuxnet-style injection
            (vad.u.VadFlags.PrivateMemory == 0 and
             protect != "EXECUTE_WRITECOPY")):
        return not self._is_vad_empty(vad, task_as)

    return False
Figure 17. Malfind.py lines 80-96 – +RWX memory detection in Malfind.
Interestingly, on the first highlighted region Malfind is excluding any memory which is not both writable and executable from its results. Notably, because Malfind is using VADs for this filter condition, the permissions it is checking will always represent the initial allocation protections of a memory region, not necessarily their current protections (which are stored in the PTE for the underlying page, not the VAD). This means that an attacker could allocate a region with an initial protection of +RW, write their payload to it and then change it to +RWX without ever triggering a Malfind detection – even though Malfind is explicitly searching for +RWX regions. Furthermore, it explains why the RW -> RX trick used by the artifact kit bypassed all of the detections in Figure 16.
As a final set of tests, ten variations of shellcode implants were generated using the artifact kit:
 Figure 18. Malfind results from scans of shellcode implant artifacts.
These results are consistent with our previous findings in Malfind: its most robust detection capability involves finding image memory corresponding to files on disks that have no entries in the PEB loaded modules list. Whether a shellcode or PE is used for an implant appears to have no impact on its detection capabilities based on the logic observed within the Rekall variation of the plugin. The Malfind plugin within the traditional Volatility framework shares these same characteristics in common with the Rekall variation, but contains some additional filter capabilities designed to reduce false positives by attempting to classify the contents of a +RWX memory region as either a PE file or assembly byte code based on its prefix bytes.
refined_criteria = >"MZ","\x55\x8B"]

for task in data:
    for vad, address_space in task.get_vads(vad_filter = task._injection_filter):

        if self._is_vad_empty(vad, address_space):
            continue

        content = address_space.zread(vad.Start, 64)

        ifself._config.REFINED and content[0:2] not in refined_criteria:
            continue

        outfd.write("Process: {0} Pid: {1} Address: {2:#x}\n".format(
            task.ImageFileName, task.UniqueProcessId, vad.Start))

        outfd.write("Vad Tag: {0} Protection: {1}\n".format(
            vad.Tag, vadinfo.PROTECT_FLAGS.get(vad.VadFlags.Protection.v(), "")))

        outfd.write("Flags: {0}\n".format(str(vad.VadFlags)))
        outfd.write("\n")

        # this is for address reporting in the output
        data_start = vad.Start

        # all zeros in the first page followed by 558B at the base of
        # the second page is an indicator of wiped PE headers
        if content.count(chr(0)) == len(content):
            if address_space.zread(vad.Start, 0x1000).count(chr(0)) == 0x1000:
                next_page = address_space.zread(vad.Start + 0x1000, 64)
                if next_page[0:2] == "\x55\x8B":
                    outfd.write("**** POSSIBLE WIPED PE HEADER AT BASE *****\n\n")
                    content = next_page
                    data_start = vad.Start + 0x1000
Figure 19. Malfind.py lines 462-495 – Volatility Malfind plugin filtering unknown +RWX regions by their first two bytes.
In Figure 19 above, Malfind is using a more refined filter algorithm. As discussed in thorough detail in part two of this series, there are many +RWX regions of private and mapped memory allocated by the Windows OS itself. This results in a significant false positive issue for memory scanners, and in the source code above Malfind attempts to address this issue by trying to determine whether or not one such +RWX region contains either a shellcode or PE file based on its first two prefix bytes. In the third highlighted region, it also attempts to detect header wiping by skipping ahead 0x1000 bytes into a +RWX region which contains no MZ PE header and attempting to identify code at this offset (which would typically correspond to the .text section in an average PE). This is a clever trick Malfind uses to achieve an outcome of filtering false positives while detecting malicious implants simultaneously, even when the malware writer was prudent enough to wipe their PE implant headers.
Hollowfind
While Malfind serves a practical role as a generic malicious memory scanner, it lacks specialization into any particular type of fileless tradecraft. In particular, it contains a significant weakness in the area of process hollowing. An alternative memory scanner, specialized into the area of process hollowing is Hollowfind. This scanner, like Malfind, is designed as a plugin for the Volatility framework and relies primarily upon VADs and other kernel objects in order to make its detections.
I began my tests by generating a series of empty executable memory regions and having them scanned:
 Figure 20. Hollowfind is used to scan a series of blank allocations made by the artifact kit.
In contrast to Malfind, Hollowfind flags both private and mapped +RWX regions as malicious even when they are empty. Similar to Malfind, the RW -> RX permission trick bypasses the generic suspicious memory region detection for MEM_PRIVATE and MEM_MAPPED regions in Hollowfind:
outfd.write("Suspicious Memory Regions:\n")
for vad, addr_space in proc.get_vads():
    content = addr_space.read(vad.Start, 64)
    if content == None:
        continue
    vad_prot = str(vadinfo.PROTECT_FLAGS.get(vad.VadFlags.Protection.v()))
    if obj.Object("_IMAGE_DOS_HEADER", offset = vad.Start, vm = addr_space).e_magic != 0x5A4D:
        flag = "No PE/Possibly Code"
        if (vad_prot =="PAGE_EXECUTE_READWRITE"):
            sus_addr = vad.Start
Figure 21. Malfind.py lines 275-284 – The generic non-hollowing detection in the Hollowfind source code.
The source code shown in Figure 21 is part of Hollowfind’s generic (not process hollowing-specific) detection logic. In the event of a +RWX region of memory (whether it be private, mapped or image) that does not contain an MZ header, a detection will always be generated. This explains why both +RWX private/mapped regions were detected in Figure 20, despite not containing any data. It also explains why the manually mapped DLLs were not detected, since technically these regions are PAGE_EXECUTE_WRITECOPY rather than +RWX and also begin with MZ headers.
Next, the artifact kit was used to generate eighteen additional variations of PE implants using different combinations of allocation types and stealth techniques.
 Figure 22. Hollowfind scanner results when applied to PE implants generated by the artifact kit.
These results highlight a very interesting trend: there are no detections on any of the private/mapped regions (for reasons shown in Figure 21) however DLL hollowing in conjunction with header wiping is detected. Notably, normal DLL hollowing is not detected. So why would DLL hollowing be detected while using a stealth technique, while the lack of the said stealth technique provides the opposite result?
if obj.Object("_IMAGE_DOS_HEADER", offset = vad.Start, vm = addr_space).e_magic != 0x5A4D:
    flag = "No PE/Possibly Code"
    if (vad_prot == "PAGE_EXECUTE_READWRITE"):
        sus_addr = vad.Start
        outfd.write("\t{0:#x}({1})  Protection: {2}  Tag: {3}\n".format(vad.Start,
                                                                        flag,
                                                                        vad_prot,
                                                                        str(vad.Tag or "")))
        if self._config.DUMP_DIR:
            filename = os.path.join(self._config.DUMP_DIR,"process.{0}.{1:#x}.dmp".format(hol_pid, sus_addr))
            self.dump_vad(filename, vad, addr_space)

    elif (vad_prot =="PAGE_EXECUTE_WRITECOPY"):
        sus_addr = vad.Start
Figure 23. Malfind.py lines 281-294 – Hollowfind source code for headerless image memory detection.
In Figure 23 above, the generic (non-hollowing) suspicious memory region detection routine is revisited. In the first highlighted region, regions without MZ headers (PE files) are filtered out. However, in the second highlighted region, an initial allocation permission of PAGE_EXECUTE_WRITECOPY is used as an IOC and criteria for the detections we observed in Figure 22. PAGE_EXECUTE_WRITECOPY is an initial allocation permission that is unique to regions of image memory. This means that in theory there should never be a region with PAGE_EXECUTE_WRITECOPY permissions that does not begin with an MZ header. It is this logic that allows Hollowfind to detect our DLL hollowing in conjunction with header wiping.
As a final set of tests, ten variations of shellcode implant were generated by the artifact kit and scanned with Hollowfind:
Figure 24. Hollowfind scan results for shellcode implant artifact variations.
The complete lack of detections for shellcode implants seen in Figure 24 is consistent with Hollowfind’s stated objective of detecting process hollowing (which typically utilizes PE implants), however there are variations of process hollowing that utilize shellcode that Hollowfind will miss based on these results. Notably, shellcode stored within +RWX regions of mapped or private memory will be detected by Hollowfind; however, due to the use of the RW -> RX permission trick by the artifact kit, no such detection is triggered.
Pe-sieve
Pe-sieve is a runtime usermode memory scanner designed to identify and dump suspicious memory regions based on malware IOCs. Similar to Moneta, it relies on usermode APIs such as NTDLL.DLL!NtQueryVirtualMemory in order to do this rather than kernel mode objects such as VADs. In contrast to Moneta, it uses a variety of data analysis tricks to refine its detection criteria rather than relying exclusively upon memory attributes alone. I began my tests by scanning a series of blank dynamic code regions using the artifact kit:
 Figure 25. Pe-sieve is used to scan a series of blank allocations made by the artifact kit.
These results are as close to a “perfect” defensive outcome as could be expected. None of these dynamic code allocations are inherently suspicious in of themselves (although, as shown previously, some scanners will mark private/mapped +RWX as suspicious regardless of its contents) with the exception of the phantom DLL load via a transacted section handle. Pe-sieve classified this region as an implant as shown in the JSON results below:
{
 "pid" : 9052,
 "is_64_bit" : 0,
 "is_managed" : 0,
 "main_image_path" : "C:\\Users\\Forrest\\Documents\\GitHub\\ArtifactsKit\\ArtifactsKit\\Release\\ArtifactsKit32.exe",
 "scanned" :
 {
  "total" : 15,
  "skipped" : 0,
  "modified" :
  {
   "total" : 1,
   "patched" : 0,
   "iat_hooked" : 0,
   "replaced" : 0,
   "hdr_modified" : 0,
   "implanted_pe":1,
   "implanted_shc" : 0,
   "unreachable_file" : 0,
   "other" : 0
  },
  "errors" : 0
 }
Figure 26. Pe-sieve scan results for blank phantom DLL region.
An explanation of the logic behind this detection can be found across several functions within pe-sieve’s code base. The region in question failed the check made by isRealMapping, a method that relies on loadMappedName that, in turn, utilizes the PSAPI.DLL!GetMappedFileNameA API.
bool pesieve::MemPageData::loadMappedName()
{
	if (!isInfoFilled() && !fillInfo()) {
		return false;
	}
	std::string mapped_filename = RemoteModuleData::getMappedName(this->processHandle, (HMODULE)this->alloc_base);
	if code (mapped_filename.length() == 0) {
#ifdef _DEBUG
		std::cerr << "Could not retrieve name" << std::endl;
#endif
		return false;
	}
	this->mapped_name = mapped_filename;
	return true;
}

bool pesieve::MemPageData::isRealMapping()
{
	if (this->loadedData == nullptr && !fillInfo()) {
#ifdef _DEBUG
		std::cerr << "Not loaded!" << std::endl;
#endif
		return false;
	}
	if (loadMappedName()) {
#ifdef _DEBUG
		std::cerr << "Could not retrieve name" << std::endl;
#endif
		return false;
	}

	...
}

std::string pesieve::RemoteModuleData::getMappedName(HANDLE processHandle, LPVOID modBaseAddr)
{
	char filename[MAX_PATH] = { 0 };
	if (!GetMappedFileNameA(processHandle, modBaseAddr, filename, MAX_PATH) != 0) {
		return "";
	}
	std::string expanded = pesieve::util::expand_path(filename);
	if (expanded.length() == 0) {
		return filename;
	}
	return expanded;
}
Figure 27. Pe-sieve phantom image region detection.
This is the same strategy I utilized in my own scanner, Moneta, to catch phantom DLL hollowing. It works by anticipating a failure to query the FILE_OBJECT underlying a region of image memory: a side-effect of the isolation intrinsic to transacted file handles that, in turn, underlie the image sections themselves.
Notably, the fact that pe-sieve does not mark unmodified manual image section mappings as malicious demonstrates a high level of sophistication in regards to false positives. As was discussed in part two of this series, there are many existing phenomena in Windows that result in image mapping with no corresponding PEB loaded modules list entry, such as metadata files.
Next, PE implants (pe-sieve’s strongest area) were scanned using every available permutation of allocation type and stealth technique in the artifacts kit for a total of eighteen variations:
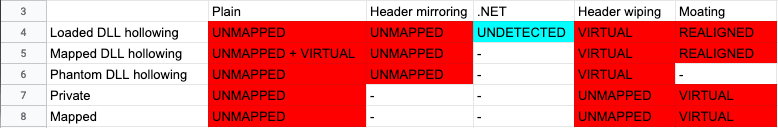 Figure 28. Pe-sieve scan results for PE artifacts
Again, these results stand as impressive when compared to the Volatility-based scanners explored previously. Every permutation of PE implant has been detected with one notable exception: DLL hollowing of a legitimately loaded .NET DLL. Exploring the reason for this caveat in pe-sieve’s detection capabilities touches on some of the conclusions in the research I conducted with my tool Moneta in the second part of this research series. Specifically, the tendency for self-modification intrinsic to some Windows modules and .NET modules in particular. The logic responsible for this lack of detection on the part of pe-sieve can be found in headers_scanner.cpp on the pe-sieve Github page:
HeadersScanReport* pesieve::HeadersScanner::scanRemote()
{
	if (!moduleData.isInitialized() && !moduleData.loadOriginal()) {
		std::cerr << "[-] Module not initialized" << std::endl;
		return nullptr;
	}
	if (!remoteModData.isInitialized()) {
		std::cerr << "[-] Failed to read the module header" << std::endl;
		return nullptr;
	}

	HeadersScanReport *my_report = new HeadersScanReport(this->processHandle, moduleData.moduleHandle, remoteModData.getModuleSize());

	BYTE hdr_buffer1[peconv::MAX_HEADER_SIZE] = { 0 };
	memcpy(hdr_buffer1, remoteModData.headerBuffer, peconv::MAX_HEADER_SIZE);
	my_report->is64 = peconv::is64bit(hdr_buffer1);
	my_report->isDotNetModule = moduleData.isDotNet();

	size_t hdrs_size = peconv::get_hdrs_size(hdr_buffer1);
	if (hdrs_size > peconv::MAX_HEADER_SIZE) {
		hdrs_size = peconv::MAX_HEADER_SIZE;
	}

	BYTE hdr_buffer2[peconv::MAX_HEADER_SIZE] = { 0 };
	memcpy(hdr_buffer2, moduleData.original_module, hdrs_size);

	// some .NET modules overwrite their own headers, so at this point they should be excluded from the comparison
	DWORD ep1 = peconv::get_entry_point_rva(hdr_buffer1);
	DWORD ep2 = peconv::get_entry_point_rva(hdr_buffer2);
	if (ep1 != ep2) {
		my_report->epModified = true;
	}
	DWORD arch1 = peconv::get_nt_hdr_architecture(hdr_buffer1);
	DWORD arch2 = peconv::get_nt_hdr_architecture(hdr_buffer2);
	if (arch1 != arch2) {
		// this often happend in .NET modules
		//if there is an architecture mismatch it may indicate that a different version of the app was loaded (possibly legit)
		my_report->archMismatch = true;
	}
	//normalize before comparing:
	peconv::update_image_base(hdr_buffer1, 0);
	peconv::update_image_base(hdr_buffer2, 0);

	zeroUnusedFields(hdr_buffer1, hdrs_size);
	zeroUnusedFields(hdr_buffer2, hdrs_size);

	//compare:
	if (memcmp(hdr_buffer1, hdr_buffer2, hdrs_size) == 0) {
		my_report->status = SCAN_NOT_SUSPICIOUS;
		return my_report;
	}
	//modifications detected, now find more details:
	my_report->dosHdrModified = isDosHdrModified(hdr_buffer1, hdr_buffer2, hdrs_size);
	my_report->fileHdrModified = isFileHdrModified(hdr_buffer1, hdr_buffer2, hdrs_size);
	my_report->ntHdrModified = isNtHdrModified(hdr_buffer1, hdr_buffer2, hdrs_size);
	my_report->secHdrModified = isSecHdrModified(hdr_buffer1, hdr_buffer2, hdrs_size);

	ifcode (moduleData.isDotNet()) {
#ifdef _DEBUG
		std::cout << "[#] .NET module detected as SUSPICIOUS\n";
#endif
		if (!my_report->isHdrReplaced()
			&& (my_report->archMismatch && my_report->epModified)
			)
		{
			//.NET modules may overwrite some parts of their own headers
#ifdef _DEBUG
			std::cout << "[#] Filtered out modifications typical for .NET files, setting as not suspicious\n";
#endif
			my_report->status = SCAN_NOT_SUSPICIOUS;
			return my_report;
		}
	}
	my_report->status = SCAN_SUSPICIOUS;
	return my_report;
}
Figure 29. Pe-sieve header scanner logic ignoring .NET modules.
Sure enough, the highlighted regions in the code in Figure 29 above illustrate that Hasherazade (the author of pe-sieve) has whitelisted .NET modules from certain detection criteria. In the first highlighted region, she states the reason for this: “some .NET modules overwrite their own headers.” Those who have read the second part in my memory forensics series will already be familiar with the phenomena she is alluding to in this comment. This particular function in pe-sieve is responsible for detecting discrepancies between the PE headers of regions of image memory and their underlying files on disk: a method which would be highly effective for detecting full overwrite DLL hollowing, but which would be bypassed using the technique of header mirroring shown in Figure 4. A further example of .NET module exemption from detection criteria can be seen in workingset_scanner.cpp.
bool pesieve::WorkingSetScanner::scanImg()
{
    const bool show_info = (!args.quiet);

    if (!memPage.loadMappedName()) {
        //cannot retrieve the mapped name
        return false;
    }

    const HMODULE module_start = (HMODULE)memPage.alloc_base;

    if (show_info) {
        std::cout << "[!] Scanning detached: " << std::hex << module_start << " : " << memPage.mapped_name << std::endl;
    }
    RemoteModuleData remoteModData(this->processHandle, module_start);
    if (!remoteModData.isInitialized()) {
        if (show_info) {
            std::cout << "[-] Could not read the remote PE at: " << std::hex << module_start << std::endl;
        }
        return false;
    }

    //load module from file:
    ModuleData modData(processHandle, module_start, memPage.mapped_name);

    const t_scan_status status = ProcessScanner::scanForHollows(processHandle, modData, remoteModData, processReport);
#ifdef _DEBUG
    std::cout << "[*] Scanned for hollows. Status: " << status << std::endl;
#endif
    if (status == SCAN_ERROR) {
        //failed scanning it as a loaded PE module
        return false;
    }
    if (status == SCAN_NOT_SUSPICIOUS) {
        if (modData.isDotNet()) {
#ifdef _DEBUG
            std::cout <<"[*] Skipping a .NET module: " << modData.szModName << std::endl;
#endif
            processReport.appendReport(new SkippedModuleReport(processHandle, modData.moduleHandle, modData.original_size, modData.szModName));
            return true;
        }
        if (!args.no_hooks) {
            const t_scan_status hooks_stat = ProcessScanner::scanForHooks(processHandle, modData, remoteModData, processReport);
#ifdef _DEBUG
            std::cout << "[*] Scanned for hooks. Status: " << hooks_stat << std::endl;
#endif
        }
    }
    return true;
}
Figure 30. Pe-sieve working set scanner logic ignoring .NET modules.
The code shown above in Figure 30 is what allows pe-sieve to detect DLL hollowing. By checking for private pages of memory corresponding to sensitive portions of a mapped image using the working set, pe-sieve is able to detect every variation of PE implant combined with DLL hollowing generated by the artifact kit, with the aforementioned exception of .NET modules. Yet again, the highlighted regions in Figure 30 illustrate how .NET modules are whitelisted from certain aspects of working set scans, a decision which allows my PE implant within a hollowed .NET module to go undetected.
A final series of tests were conducted using ten variations of shellcode implant:
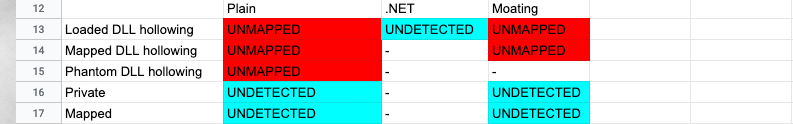 Figure 31. Pe-sieve scanner results for shellcode implants.
While the cause for the lack of detection of shellcode implants within .NET modules is simple to understand (these would also bypass the scanForHooks routine in the working set scanner) the lack of detection for MEM_PRIVATE and MEM_MAPPED regions in Figure 31 is particularly interesting. Keep in mind, that pe-sieve was highly effective at detecting PE implants within private and mapped memory (Figure 28 demonstrated this) even when techniques such as header wiping and even moating were applied. Therefore, it is not the case that Hasherazade was unaware of the suspicious nature of such memory when designing pe-sieve, but rather that she deemed the false positive potential of flagging executable private/mapped regions too high to be worth the risk without sufficient evidence. In this case, she relies upon additional IOC within such regions to indicate the presence of a PE before triggering a detection. Impressively, this is something she is able to do even when there is no PE header and the .text section cannot be found at a reliable offset. This is a strategy in stark contrast to my own tool Moneta, which avoids all explicit data analysis and instead relies upon other clues within a process to indicate a just cause for the presence of such dynamic code regions (for example +RWX private regions created as .NET heaps by the CLR). Detection for such shellcode implants within private and mapped memory appear to be the only significant blind spot in pe-sieve.
Last Thoughts
As I stated in the conclusion to part two of this series, the phenomena I observed through use of Moneta has led me to the belief that fileless malware utilizing dynamic code cannot be reliably detected without bytescan signatures unless substantial efforts are taken by an advanced defender to perfectly profile and filter the false positives inherent to the Windows OS and common third party applications. My findings throughout this text, while testing existing defensive scanners, are consistent with this theory. The Volatility-based plugins were exceptionally outdated and as shown here are trivially simple to bypass. Pe-sieve is considerably more sophisticated but has clear weak points in areas prone to false positives.
This basic reality will have enduring consequences for the detection of fileless malware. Defenders are at a considerable disadvantage in this area while attackers need only educate themselves on the basics of memory stealth tradecraft in order to put themselves outside the reach of detection.


